For four years, the share of UK retail sold online barely moved. After the lockdown surge faded, online sales settled at a little over a quarter of all retail spending and stayed there from 2022 to 2025, long enough for “ecommerce has peaked” to become a common view in British retail.
The 2026 data says otherwise. We analyzed every monthly reading in the Office for National Statistics internet sales dataset, from November 2006 to August 2026, and the plateau has broken: online sales are growing more than twice as fast as total retail this year, and the online share is climbing at its fastest pace since the pandemic.
This study covers how the UK got from 3% to 28% online, what happened to the pandemic surge, which kinds of retailers are winning online, and what the numbers mean for anyone selling to British shoppers.
Key findings
- The online share of UK retail rose from 3.4% in 2007 to 27.5% in 2025. Before the pandemic it grew by about 1.3 percentage points a year.
- From 2022 to 2025 it stalled. The online share for January to August was 26.3%, 26.0%, 26.3% and 26.4% in those four years.
- In 2026 it broke out. The January to August share jumped to 27.9%, and online sales values rose 10.7% against 4.7% for retail overall and 2.6% for in-store sales.
- The pandemic surge has been absorbed by the long-run trend. In 2025 the online share was 27.5%, almost exactly where the 2010 to 2019 trend line put it (27.0%).
- Online took about 64% of all UK retail sales growth between 2019 and 2025, while in-store sales grew 10.2% in cash terms over six years.
- Store-based retailers now make most UK online sales. Retailers without stores accounted for 52.7% of online sales value in 2019 and 47.1% in 2025.
- Food stores more than doubled their online sales (up 120.7% from 2019 to 2025), and November is now the UK’s biggest online month, at an average 31.3% online share over the last three years.
How we analyzed the data
The ONS publishes internet sales as part of its monthly Retail Sales Index for Great Britain. Internet sales are retail sales where the order is placed online, whether the retailer is a pure online seller or a chain with stores.
We used two parts of the dataset:
- Annual and year-to-date shares were calculated from non-seasonally adjusted average weekly sales values, summing internet sales and total retail sales over each period. This weights each month by how much was actually spent, rather than averaging monthly percentages.
- Store-type comparisons use the seasonally adjusted share of each store type’s sales made online, averaged across the twelve months of each year, and seasonally adjusted average weekly online sales values by store type.
The pre-pandemic trend line is a straight-line fit through the annual online shares for 2010 to 2019. All values are in current prices, so growth figures are not adjusted for inflation. Shares are ratios of two current-price values, so inflation affects them only to the extent that prices rise differently online and in stores.
From 3% to 28%: two decades of UK online retail
The long-run picture is one of remarkably steady growth, followed by a shock and a reset.
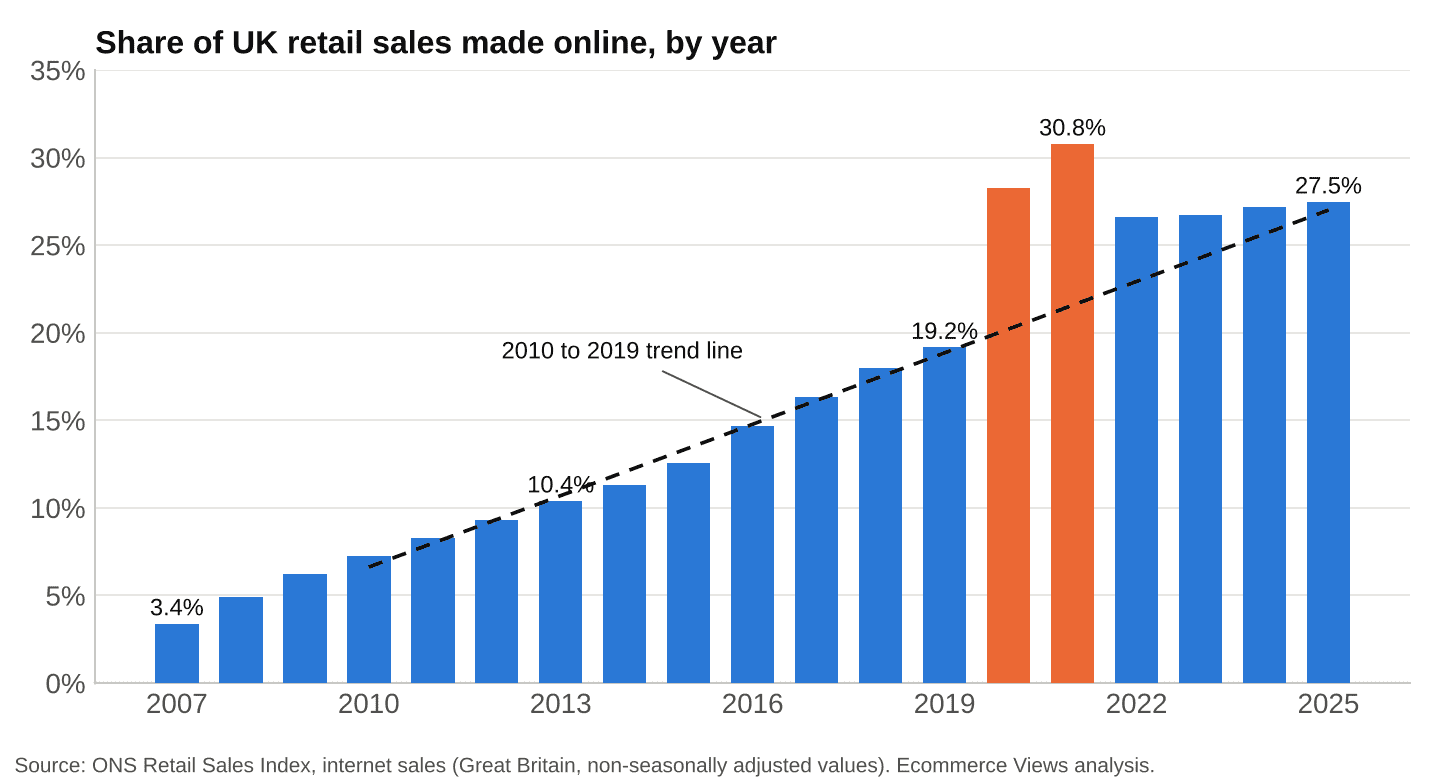
Share of UK retail sales made online, by year, 2007 to 2025
Between 2007 and 2019 the online share rose every single year, from 3.4% to 19.2%, an average gain of 1.3 percentage points a year. The 2010 to 2019 trend line fits that period closely, with a slope of 1.36 points a year.
Then came 2020. The annual share jumped to 28.2% and reached 30.8% in 2021, and on a monthly basis it peaked at 37.8% in January 2021, when non-essential stores were closed. Sales that would have taken years to move online moved in months.
When stores reopened, part of that demand went back. The annual share fell to 26.6% in 2022, and in cash terms UK online sales dropped from roughly £130 billion in 2021 to £117 billion in 2022, the only annual fall in the series. How the UK’s path compares with other large markets is covered in our overview of ecommerce by region.
| Year | Online share of retail | Approx. annual online sales |
|---|---|---|
| 2007 | 3.4% | £9.2 billion |
| 2013 | 10.4% | £33.4 billion |
| 2019 | 19.2% | £75.4 billion |
| 2020 | 28.2% | £111.7 billion |
| 2021 | 30.8% | £129.7 billion |
| 2022 | 26.6% | £117.1 billion |
| 2023 | 26.7% | £123.5 billion |
| 2024 | 27.2% | £127.1 billion |
| 2025 | 27.5% | £132.8 billion |
Annual sales are estimated from ONS average weekly values multiplied by 52.14 weeks, in current prices.
The four-year plateau
The most striking feature of recent UK data is how little the online share moved after the reset. Comparing the same January to August window each year removes the effect of the strong November and December months and of the latest year being incomplete:
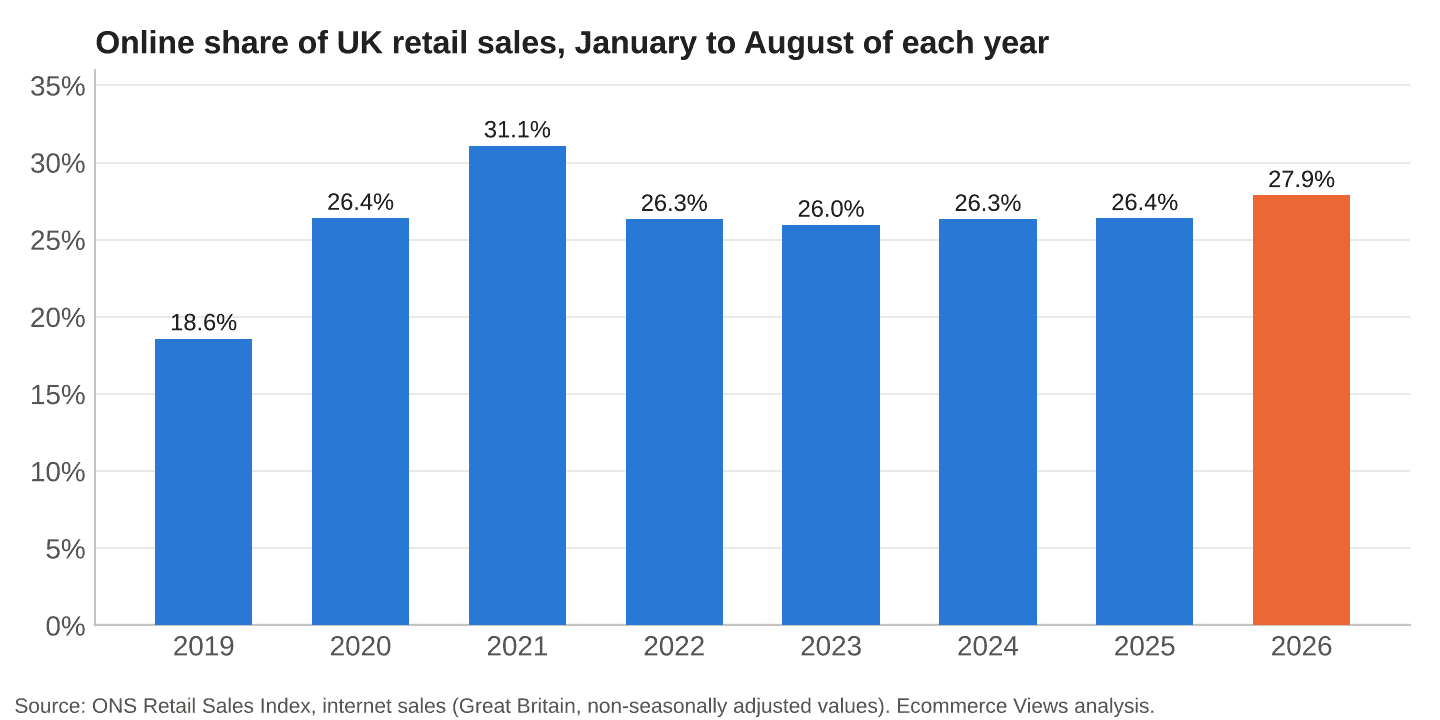
Online share of UK retail sales, January to August of each year, 2019 to 2026
From 2022 to 2025 the share was stuck in a band of less than half a percentage point: 26.3%, 26.0%, 26.3% and 26.4%. Over the full years, it grew by an average of 0.29 points a year from 2022 to 2025, less than a quarter of the pre-pandemic pace. Online sales were still rising in cash terms, but only as fast as retail overall. In the first eight months of 2025, online sales values grew 3.0% and total retail 2.9%.
That flat line is what produced the “online has peaked” narrative. It is also what makes 2026 notable.
2026: the plateau breaks
In the first eight months of 2026, the online share reached 27.9%, a gain of 1.5 percentage points on the same period of 2025. That is more than the share gained in the previous three full years combined.
The growth is broad, not a one-month spike. Every month from January to August 2026 posted an online share between 27.3% and 28.7%, and each was above the same month of 2025. The underlying sales numbers show why:
- Online sales values: up 10.7% year on year for January to August
- Total retail sales values: up 4.7%
- In-store sales values: up 2.6%
The ONS’s own August 2026 retail sales bulletin confirms the momentum: online spending values in the three months to August were 10.1% higher than a year earlier, and on a seasonally adjusted basis the proportion of sales made online rose from 28.4% in July to 28.8% in August.
The data does not say why online growth picked up, and a single year is not yet a trend. But it does rule out the idea that the UK reached a natural ceiling for online retail at around a quarter of sales.
Where the pandemic surge went
The clearest way to read the last six years is against the pre-pandemic trend line. If online retail had kept growing at its 2010 to 2019 pace, with no pandemic at all, the online share would have been:
| Year | Pre-pandemic trend | Actual online share | Gap |
|---|---|---|---|
| 2020 | 20.2% | 28.2% | +8.0 points |
| 2021 | 21.6% | 30.8% | +9.2 points |
| 2022 | 22.9% | 26.6% | +3.7 points |
| 2023 | 24.3% | 26.7% | +2.4 points |
| 2024 | 25.6% | 27.2% | +1.5 points |
| 2025 | 27.0% | 27.5% | +0.5 points |
The gap closed every year after 2021. The pandemic did not permanently raise the UK’s online share above its long-run path. At the 2021 peak it had pulled about six years of growth forward, and the plateau that followed was the trend catching up with that jump.
That reading also explains why 2026 looks different. With the surge fully absorbed, online retail appears to be back on something close to its old trajectory, which projects to about 28.4% for 2026 as a full year. The US went through its own version of this pull-forward, which we traced in our analysis of 27 years of Census data, and the UK data now shows how a more mature online market behaves once the effect wears off.
Online took most of the growth
Measured by money rather than share, online has captured most of what UK retail has added since 2019. Total annual retail sales values rose by about £90 billion between 2019 and 2025 in cash terms, and online accounted for 63.9% of that increase.
Over the same six years:
- Online sales values grew 76.0%, from about £75 billion to about £133 billion a year
- In-store sales values grew 10.2%, in current prices, before any adjustment for inflation
Physical stores still make almost three quarters of UK retail sales, but they are now a slow-growing majority, and nearly all of the momentum sits online.
Which store types sell the most online
The ONS splits retailers by their main activity, and the change since 2019 has been uneven across store types.
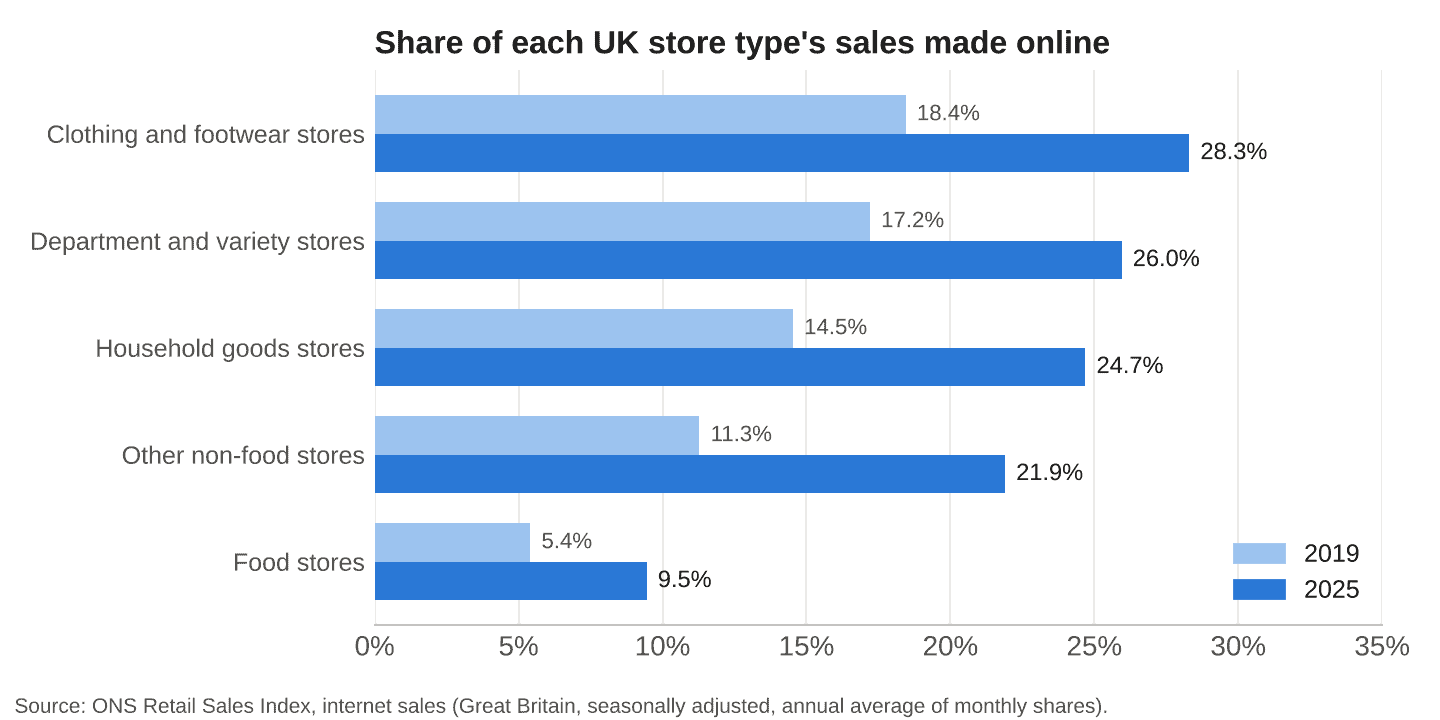
Share of each UK store type’s sales made online, 2019 and 2025
- Clothing and footwear stores sell the highest share online among store-based retailers, 28.3% in 2025 against 18.4% in 2019. During the lockdowns their online share hit 63.2% in February 2021, the highest of any store-based retailer group.
- Department and variety stores reached 26.0%, up from 17.2%.
- Household goods stores, such as furniture, electrical and DIY retailers, reached 24.7%, up from 14.5%.
- Other non-food stores, a group that includes chemists, toy, book, sports and jewelry stores, almost doubled their online share, from 11.3% to 21.9%.
- Food stores remain the least online, but their share nearly doubled from 5.4% to 9.5%.
The growth rates by value tell the same story. Between 2019 and 2025, online sales by food stores grew 120.7% and by other non-food stores 138.2%, against 76.0% for online retail overall. Categories built on everyday purchases are where the most new online spending is coming from, which fits the case we made in sell what people run out of, not what’s trending.
Store-based retailers now make most UK online sales
The ONS also tracks non-store retailers: businesses with no physical shops, which are mostly online sellers but also include market stalls and mail order. Their own sales are now almost entirely online, at an 89.1% share in 2025.
Yet their slice of the UK online market is shrinking:
| Seller type | Share of UK online sales, 2008 | 2019 | 2025 |
|---|---|---|---|
| Non-store retailers | 41.6% | 52.7% | 47.1% |
| Non-food stores | 41.2% | 35.3% | 37.9% |
| Food stores | 17.2% | 12.0% | 15.1% |
Shares of seasonally adjusted average weekly online sales values.
In 2019, retailers without stores made more than half of all UK online sales. By 2025, store-based retailers had taken the majority back, with food stores alone gaining three percentage points. Chains used the pandemic to build delivery, click-and-collect and app ordering at scale, and those channels stayed. For pure online sellers, the competition in the UK is now as much with established high-street names as with other ecommerce brands, and fast, cheap delivery is part of how those chains compete. Our guide to last-mile delivery covers the options open to smaller sellers.
November is the UK’s online month
Seasonality in the UK online share is sharp and has become more pronounced. Averaging the last three years (2023 to 2025), the online share of retail by month was:
| Month | Average online share, 2023 to 2025 | 2019 |
|---|---|---|
| January | 27.1% | 19.3% |
| April | 26.1% | 18.4% |
| August | 25.6% | 18.1% |
| October | 27.5% | 19.1% |
| November | 31.3% | 21.6% |
| December | 28.9% | 21.4% |
Since the start of 2023, November is the only month in which the online share has topped 30%, and it has done so every year: 31.3% in 2023, 30.3% in 2024 and 32.4% in 2025. In 2019, November’s share was about 2.5 points above the annual figure; now the gap is about 4 points. The Black Friday period is where online sellers get the most attention from UK shoppers, which is exactly why it is the most competitive point of the year, a dynamic we looked at in why Black Friday is the wrong battle for small online stores.
What this means for online sellers
Read together, the numbers point to a few practical conclusions for anyone selling to UK customers:
- Do not plan for a flat market. The 2022 to 2025 plateau was a hangover from the pandemic, not a ceiling. If the 2026 pace holds, online is gaining share again at close to its pre-pandemic rate.
- Expect the strongest growth in everyday categories. Food and “other” non-food stores have grown online sales fastest since 2019. Repeat purchases, subscriptions and replenishment are where new online spending is concentrating.
- Treat high-street chains as online competitors. Store-based retailers make the majority of UK online sales again. Matching their delivery and returns convenience matters more than it did five years ago.
- Plan inventory and cash for November. Nearly a third of UK retail spending goes online in November, so the month matters disproportionately for online sellers, whatever discounting strategy a store chooses.
- Benchmark against the right number. A UK store growing online sales by 3% a year was keeping pace with the market in 2025. In 2026, the market is growing at about 10%.
Practical ways to grow faster than the market are covered in our guide on how to increase ecommerce sales in 2026.
Limits of the data
The ONS figures are the most complete public record of UK online retail, but they have boundaries worth knowing:
- Great Britain only. The Retail Sales Index excludes Northern Ireland.
- Retail only. Online spending on travel, hospitality, financial services and most services is not included.
- Classification by main activity. Retailers are grouped by what they mainly sell, so a clothing chain’s online homeware sales count under clothing stores.
- Current prices. Sales values are not adjusted for inflation; shares are less affected, but cash growth rates include price rises.
- Revisions. Recent months are revised as more survey returns arrive, so the 2026 figures may change slightly. The full methodology is in the ONS retail sales quality and methodology information.
The next ONS release, covering September 2026, is due on 23 October 2026. If the online share stays near 28% through the autumn, 2026 will be the first year since 2021 that online retail has clearly outgrown the rest of the UK market.