US Ecommerce Growth in 2026: What 27 Years of Census Data Reveal
Every quarter, the US Census Bureau publishes the number most of the ecommerce industry quotes back to itself: the share of retail sales that happens online. In the second quarter of 2026 it reached 17.1%, the highest figure on record. The headline gets repeated everywhere, including in our own overview of ecommerce by region, but a single quarter says very little about where online retail is actually heading.
So we went back to the start. We took the full Census series, 107 quarters from the fourth quarter of 1999 to the second quarter of 2026, fitted the pre-pandemic trend, measured how far the market has moved away from it, and paired the results with the Census breakdown of online sales by product category. The goal was to answer the questions store owners actually ask: did the pandemic boom fade, is growth slowing for good, and which categories moved online fastest?
Key findings
- The pandemic lifted ecommerce onto a higher line and it never came back down. The share of retail sold online is 2.2 percentage points above where the 2010 to 2019 trend pointed, a level the old trend would not have reached until the end of 2029.
- 2025 was the slowest year for online sales growth since 2009, at 5.3%. Then growth snapped back. Online sales rose 11.2% in the first half of 2026, and 12.2% in the second quarter alone, the fastest pace since the second quarter of 2021.
- Ecommerce wins about three of every ten new retail dollars. Since the end of 2019, online sales accounted for 29.6% of all growth in US retail sales, far above their 11.2% share of sales when the period began.
- Each five-point gain is arriving faster. Going from a sustained 5% to a sustained 10% share took just over seven years; going from 10% to 15% took four.
- Furniture and food moved online fastest. Among retailers that sell mainly online or by mail, online furniture sales grew 88% between 2019 and 2022 and online food and drink sales grew 121%.
- The holiday quarter keeps gaining weight. In the fourth quarter of 2025, 18.3% of unadjusted retail sales happened online.
How we analyzed the data
The core dataset is the Census Bureau’s Quarterly E-commerce Report, which estimates total US retail sales and the portion ordered online, from the fourth quarter of 1999 onward. We used the seasonally adjusted series, which removes the regular holiday spike so that quarters can be compared with each other, and switched to the unadjusted series only when the holiday effect itself was the subject.
A few choices shape the results, and they are worth knowing before reading the numbers:
- All figures are in current dollars. Census does not adjust them for inflation, so growth rates include price changes.
- The trend line is a simple linear fit on the 40 quarters from the first quarter of 2010 to the fourth quarter of 2019, a period of steady, uninterrupted growth. Over those ten years the online share rose by 0.68 percentage points a year.
- The category analysis uses a separate Census survey, described in its own section below, which runs only to 2022.
Finding 1: The pandemic did not borrow growth from the future
In early 2020, the online share of retail jumped from 11.9% to 16.3% in a single quarter as stores closed. The common prediction afterwards was that the jump was “pulled forward” demand, and that once shoppers returned to stores the online share would sink back toward its old path and pay the difference back.
The data says that never happened. Plotting the full seasonally adjusted series against the extended 2010 to 2019 trend shows the gap shrinking from 5.5 points at the peak to 2.1 points by the second quarter of 2022, as stores reopened. Then it stopped shrinking. For four years the online share has run between 2.1 and 2.6 points above the old trend. In the second quarter of 2026 the trend line sits at 14.9%; the actual figure is 17.1%.
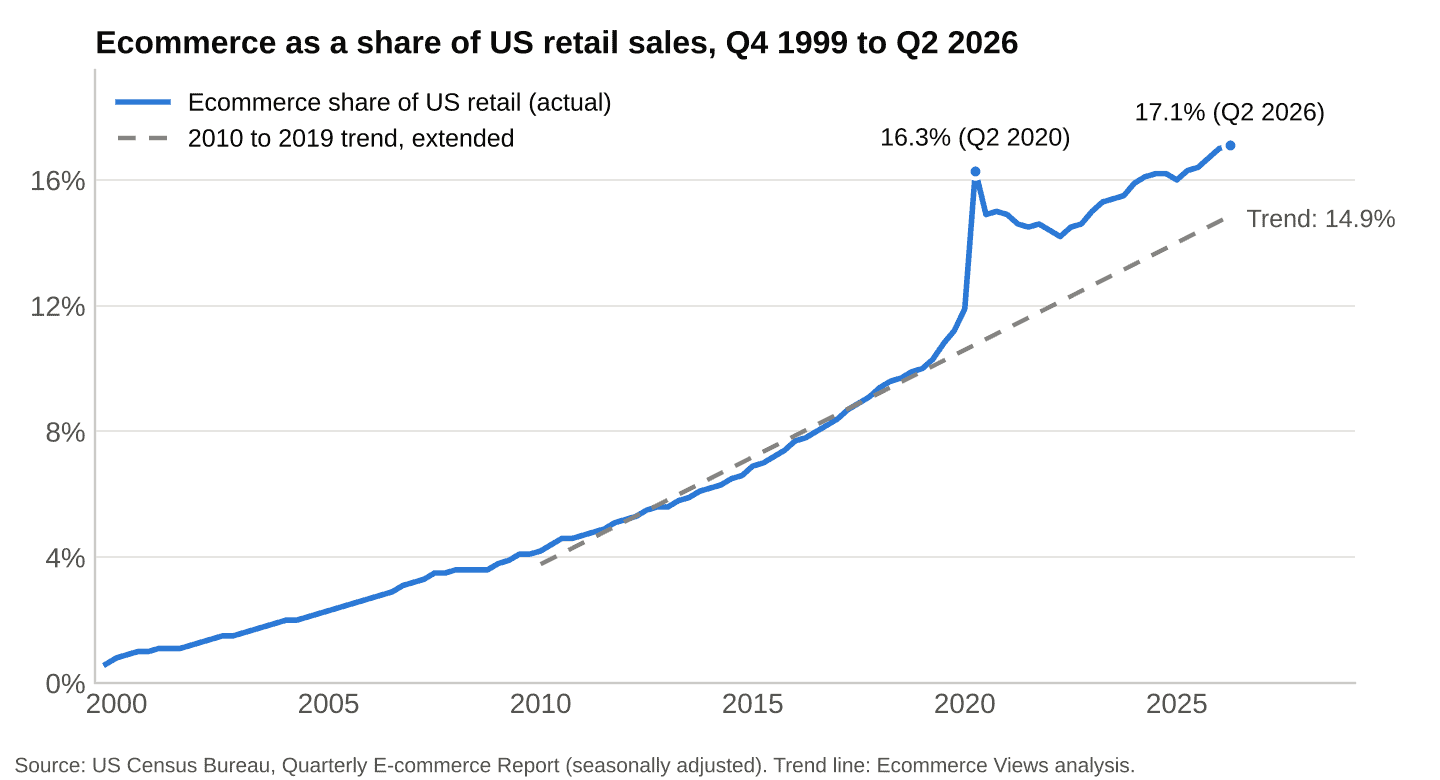
Ecommerce share of US retail sales against the pre-pandemic trend, Q4 1999 to Q2 2026
Put differently, the old trend would not have reached 17.1% until the fourth quarter of 2029. The pandemic moved US ecommerce roughly three and a quarter years ahead of schedule, and it has kept that lead. What changed is the level, not the direction. Since the second quarter of 2022, the share has climbed by 0.56 to 0.67 points a year depending on the starting quarter, close to the pre-pandemic pace of 0.68, or a touch slower.
Finding 2: The 2025 slowdown ended in 2026
Measured in sales rather than share, the story is one of a long cooldown followed by a sudden pickup. Between 2016 and 2019, online sales grew between 12.5% and 15.5% a year while total retail grew between 2.3% and 4.5%. After the 41.9% surge of 2020, growth fell steadily: 17.8% in 2021, 6.5% in 2022, 8.8% in 2023, 7.6% in 2024 and 5.3% in 2025.
Two of those years stand out. In 2022, online sales grew more slowly than total retail, the only year in the series where that happened, as shoppers flooded back into stores. And 2025 was the slowest year for online growth since 2009, when the financial crisis held it to 2.2%. It was a fair moment to ask whether ecommerce was simply worth it anymore, a question we looked at from a store owner’s side in is ecommerce worth it in 2026.
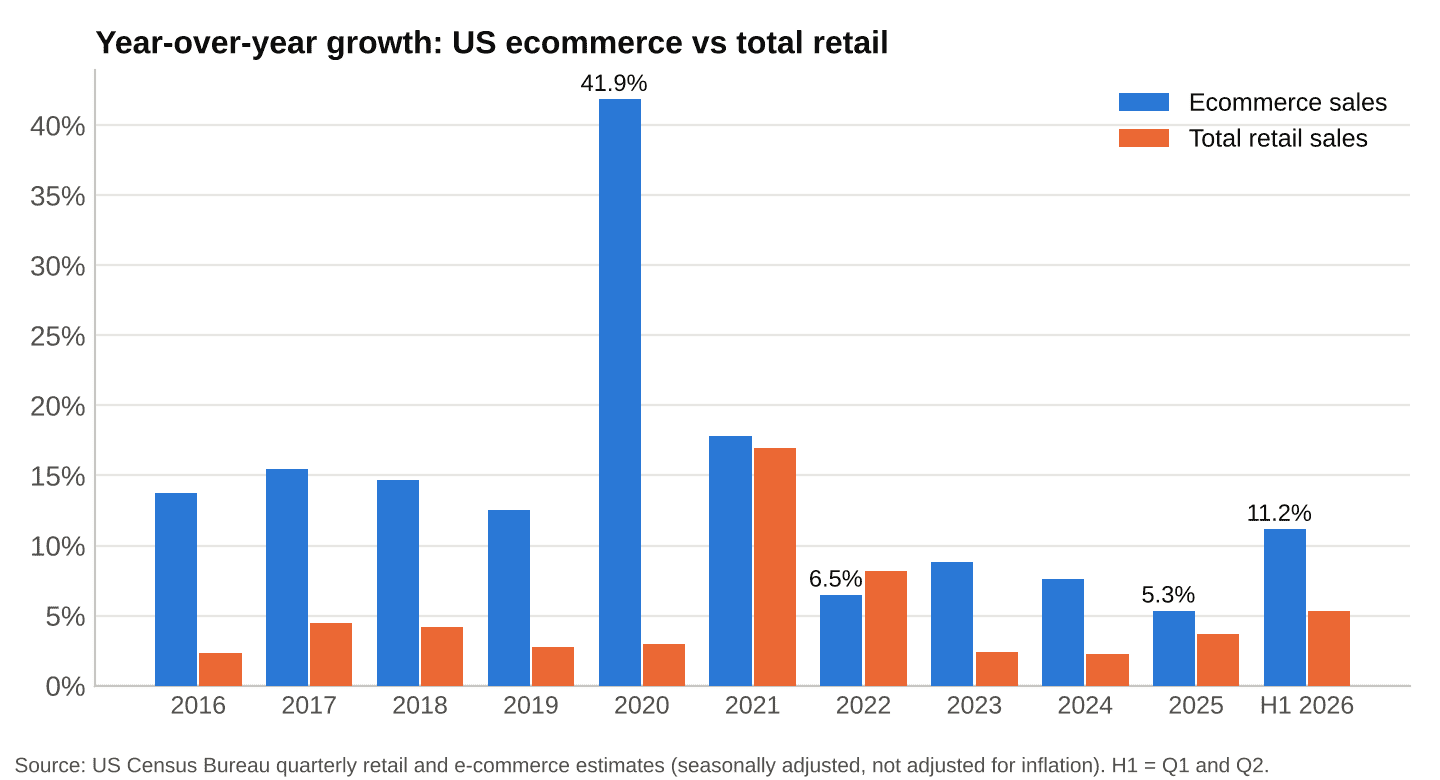
Year-over-year growth of US ecommerce sales vs total retail sales, 2016 to H1 2026
The first half of 2026 changed the picture. Online sales rose 10.1% year over year in the first quarter and 12.2% in the second, the fastest rate since the second quarter of 2021. Over the half year, online sales grew 11.2% while total retail grew 5.3%, a gap of almost six points, compared with 1.6 points in 2025. Because the figures are not adjusted for inflation, part of any acceleration can reflect prices rather than volume, and Census does not publish a separate price index for online sales. Even so, the gap between online and total retail growth is measured on the same nominal basis, and it widened sharply.
Finding 3: Three of every ten new retail dollars go online
Share figures understate how much ecommerce matters for growth, because they describe the whole stock of retail rather than the change. Looking at the change tells a sharper story:
- Since the end of 2019, quarterly US retail sales grew by $642.2 billion, and online sales accounted for $190.0 billion of that increase, or 29.6%.
- In the last twelve months, from the second quarter of 2025 to the second quarter of 2026, retail grew by $124.9 billion a quarter and ecommerce captured $37.0 billion of it, again 29.6%.
- In the decade before the pandemic, from early 2010 to late 2019, ecommerce took 26.0% of retail growth.
Online sales are about one-sixth of retail but are winning closer to one-third of the new money. That is not a story of stores collapsing: sales outside ecommerce still grew 5.6% year over year in the second quarter of 2026. It is a story about where the marginal customer is, and it is why the channel choices in our guide on how to increase ecommerce sales in 2026 matter more than they did a few years ago.
Finding 4: Each milestone arrives faster than the last
One way to see the momentum is to measure how long each step took. We counted a milestone as the first quarter from which the share never dropped back below the level again.
| Milestone | Reached and held from | Years since previous milestone |
|---|---|---|
| 1% of retail | Q3 2000 | |
| 5% of retail | Q4 2011 | 11.3 |
| 10% of retail | Q1 2019 | 7.3 |
| 15% of retail | Q1 2023 | 4.0 |
| Above the 2020 peak of 16.3% | Q3 2025 | 2.5 |
The 15% mark was first touched during the pandemic spike but only held for good from 2023. The online share then needed more than five years to climb back past its 2020 peak, which it finally did in the third quarter of 2025, at 16.4%.
Finding 5: Furniture caught up with clothing online
The quarterly report does not break sales down by product, so for categories we used the Census Annual Retail Trade Survey table of online sales by merchandise line. It covers electronic shopping and mail-order houses, the retailers that sell mainly online or by mail, rather than every store’s website, and it runs to 2022. Within that group, online sales rose from $477.3 billion in 2019 to $827.9 billion in 2022, up 73.5%.
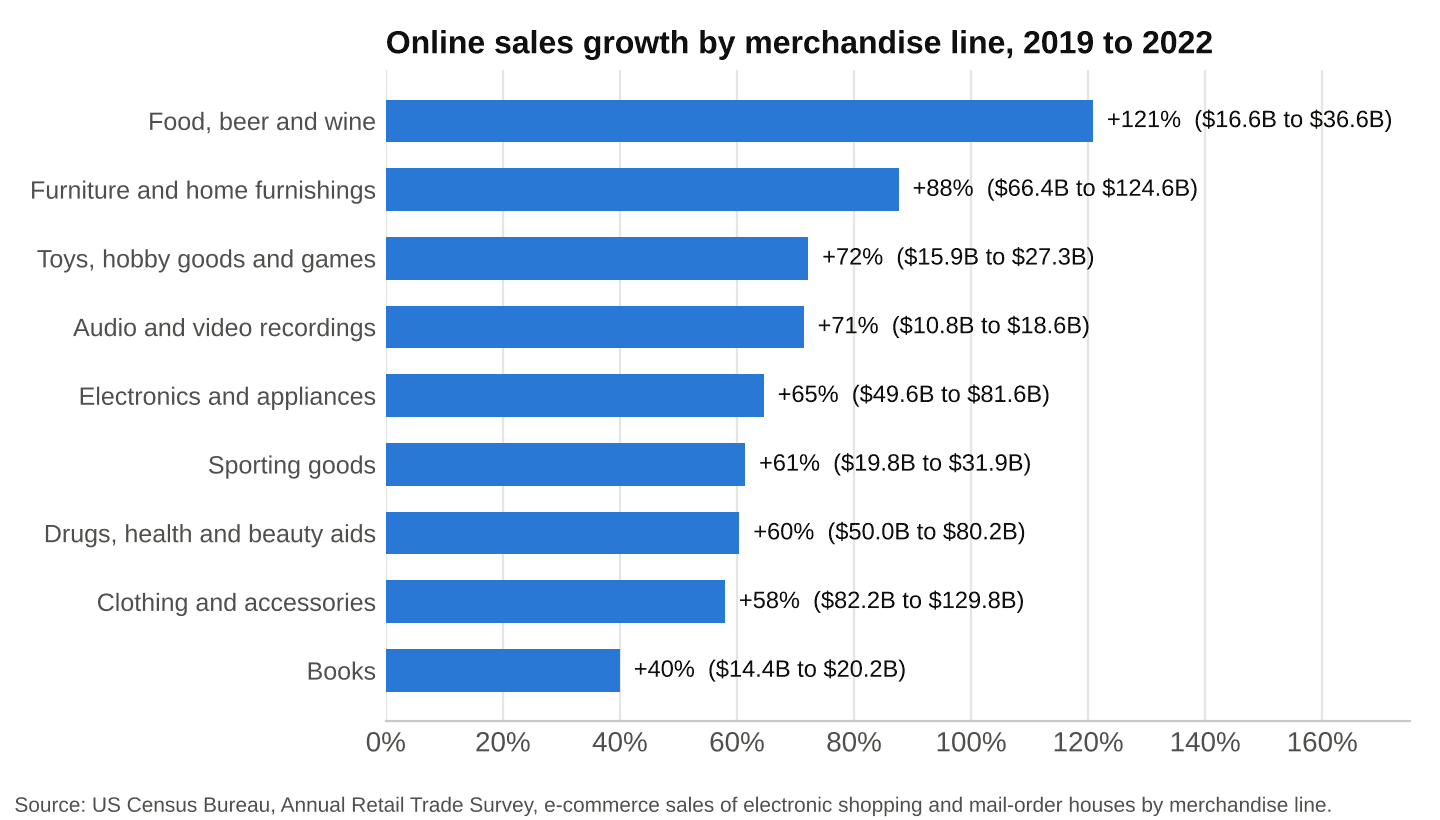
Online sales growth by merchandise line at US online and mail-order retailers, 2019 to 2022
The ranking overturns a few assumptions about what sells online:
- Food, beer and wine grew fastest, up 121% from $16.6 billion to $36.6 billion, and up 355% since 2015.
- Furniture and home furnishings nearly matched clothing. Online furniture sales reached $124.6 billion in 2022, up 88% since 2019 and more than four times their 2015 level, against $129.8 billion for clothing and accessories.
- Electronics and appliances grew 65%, to $81.6 billion.
- Drugs, health and beauty aids grew 60%, to $80.2 billion, yet only 30.7% of that line’s sales at these retailers came through online orders, with the rest flowing through mail and phone channels such as mail-order pharmacies.
- Books grew slowest, up 40%, a category that moved online so early that it had less room left to grow.
Bulky, considered purchases like sofas and frequent, low-ticket replenishment like groceries were both supposed to resist ecommerce. They became its fastest-growing lines.
Finding 6: The holiday quarter keeps getting heavier
Seasonal adjustment hides one pattern that matters a great deal to anyone planning stock: how much more of the fourth quarter happens online than the rest of the year. Comparing the unadjusted fourth-quarter share with the adjusted one shows the holiday premium widening steadily:
| Fourth quarter | Online share, unadjusted | Online share, adjusted | Holiday premium |
|---|---|---|---|
| 2015 | 8.5% | 7.4% | +1.1 points |
| 2019 | 12.4% | 11.2% | +1.2 points |
| 2022 | 16.0% | 14.6% | +1.4 points |
| 2023 | 17.1% | 15.5% | +1.6 points |
| 2024 | 17.8% | 16.2% | +1.6 points |
| 2025 | 18.3% | 16.7% | +1.6 points |
In the fourth quarter of 2025, unadjusted online sales reached $365.2 billion, 21.8% more than in the third quarter. For a store, that means a growing share of the year’s demand lands in about ten weeks, which puts more pressure on stock planning and cash flow than the annual averages suggest. The planning side of that is covered in our guide to essential inventory management strategies.
Where the trend points next
Extending the post-2022 pace of 0.56 to 0.67 points a year from today’s 17.1% puts the online share of US retail at 20% somewhere between late 2030 and late 2031, and at 25% between 2038 and 2040. That is a pace calculation, not a forecast: it assumes no new shock in either direction, and the series has already shown that a single event can move it several years in one quarter.
What the calculation does show is that “one in five retail dollars online” is about five years away on the current path, not a distant prospect. The forces likely to push it faster or slower, from AI shopping assistants to marketplace consolidation, are the subject of our look at ecommerce trends for 2026.
What this means for online stores
The 27-year view leads to a handful of practical conclusions:
- Plan for high-single-digit market growth, not the 15% years. The 2016 to 2019 pace is not coming back as a baseline, but neither is the 5% of 2025.
- Treat the step up as permanent. Shoppers who moved online in 2020 stayed, which makes them a customer base to retain rather than a wave to ride.
- Look again at categories you ruled out. Furniture and groceries were the fastest-growing online lines between 2019 and 2022, which makes delivery capability, not product type, the real constraint. For bulky goods, that means getting last-mile delivery right before scaling the catalog.
- Weight the fourth quarter more heavily every year. A rising holiday premium means stock, staffing and ad budgets need to tilt toward the last ten weeks.
- Read the quarterly figures as a pair. A rise in online share means little without the growth gap against total retail, and the 2026 widening of that gap is the signal worth watching.
Limitations of the data
Census estimates come from a sample survey, with a coefficient of variation of about 2.2% on the latest online sales figures, so quarter-to-quarter movements of a few tenths of a point sit within normal sampling noise. Since the benchmark revision released in April 2025, the quarterly estimates cover only businesses with paid employees, so very small online sellers without staff are not included. The merchandise line detail stops in 2022 because Census merged the Annual Retail Trade Survey into the new Annual Integrated Economic Survey, and comparable category tables have not yet been published for later years. None of these limits changes the direction of the findings, but they are reasons to read individual quarters with some caution.