Ecommerce Profit Calculator: What Each Order Really Earns After Fees, Shipping, Returns and Ads
Most store dashboards are built to show revenue. Orders, average order value, conversion rate, return on ad spend: every headline number is a version of how much money came in. None of them says how much of a typical order the store actually keeps once the product, the shipping label, the payment processor, the marketplace, the returns and the ads have all been paid.
That gap matters more than most owners assume. Census Bureau figures put the gross margin of US online and mail-order retailers at 39.6% of sales in 2022, down from 40.8% a year earlier. Gross margin is what is left after product cost and before everything else. On a typical online store, shipping, fees, returns and advertising then have to fit inside those 40 cents per dollar, and on many orders they do not.
The calculator below works out profit per order for any product and sales channel, with presets for an own store, Amazon, Etsy and eBay based on each platform’s published fees. The rest of this article explains how it works, walks through a worked example, and shows which inputs move profit the most.
Ecommerce Profit per Order Calculator
Enter one typical order. The calculator subtracts product cost, shipping, payment and marketplace fees, expected returns and ad spend, then shows what you keep and how much you can afford to pay for a sale.
Presets use published rates (Stripe and Shopify card rates, PayPal Checkout, Amazon’s 15% referral categories with a 0.30 minimum, Etsy’s US transaction, processing and listing fees, eBay’s most-category final value fee). Check your own category and country, as rates vary. Returns assume the item price is refunded, outbound shipping is not, and fees are not returned unless you set the Advanced field. Monthly subscription fees such as Amazon’s Professional plan belong in fixed costs.
How to use the calculator
Enter the numbers for one typical order, not an average across the whole catalog. Profit is decided product by product, and averaging a high-margin bestseller with a low-margin add-on hides both. The inputs fall into five groups:
- Order: the product price, any shipping you charge the customer, and any discount applied.
- Costs: the landed product cost (purchase price plus inbound freight and duties), packaging and handling, the shipping label you pay for, and the average ad spend needed to win the order.
- Fees: the payment processing rate and fixed fee, and any marketplace or platform commission. Choosing a channel preset fills these in.
- Returns: the share of orders returned, what a return costs you to ship and process, and how much of the returned stock can be resold at full price.
- Monthly fixed costs: your platform plan, apps, tools and any salaries, used to work out how many orders cover the month.
The results show profit per order, profit margin, the most you can spend on ads to win an order and still break even, the break-even return on ad spend, and how many orders a month cover your fixed costs.
The formula behind it
The calculator applies the same seven steps you could run in a spreadsheet:
- Order revenue = product price × (1 − discount) + shipping charged to the customer.
- Fees = payment rate × revenue + fixed payment fee + marketplace rate × revenue (or the minimum fee, whichever is higher) + any fixed marketplace fee.
- Expected returns cost = return rate × (refunded product price + return shipping + processing cost − product cost × share of returns that can be resold − any fees refunded to you).
- Left before ads = revenue − product cost − packaging − shipping you pay − fees − expected returns cost.
- Profit per order = left before ads − ad spend per order.
- Break-even ROAS = revenue ÷ left before ads.
- Orders to cover fixed costs = monthly fixed costs ÷ profit per order.
Step 3 is where most quick calculations go wrong. A return does not just cancel a sale: the store has usually already paid the outbound label and the processing fee, then pays for the return label and the handling, and only recovers the stock if it can be resold.
A worked example: the $60 order that loses money
Take a $60 product sold on an own store with free shipping and card payments through a processor charging the standard 2.9% + 30¢ per transaction. The assumptions are deliberately ordinary:
- Product cost of $36, a 40% gross margin, close to the Census average for online retailers
- $1 of packaging and $8 for the outbound shipping label
- A 10% return rate, with $7 return shipping, $2 of handling per return and 80% of returned items resold
- $10 of ad spend per order
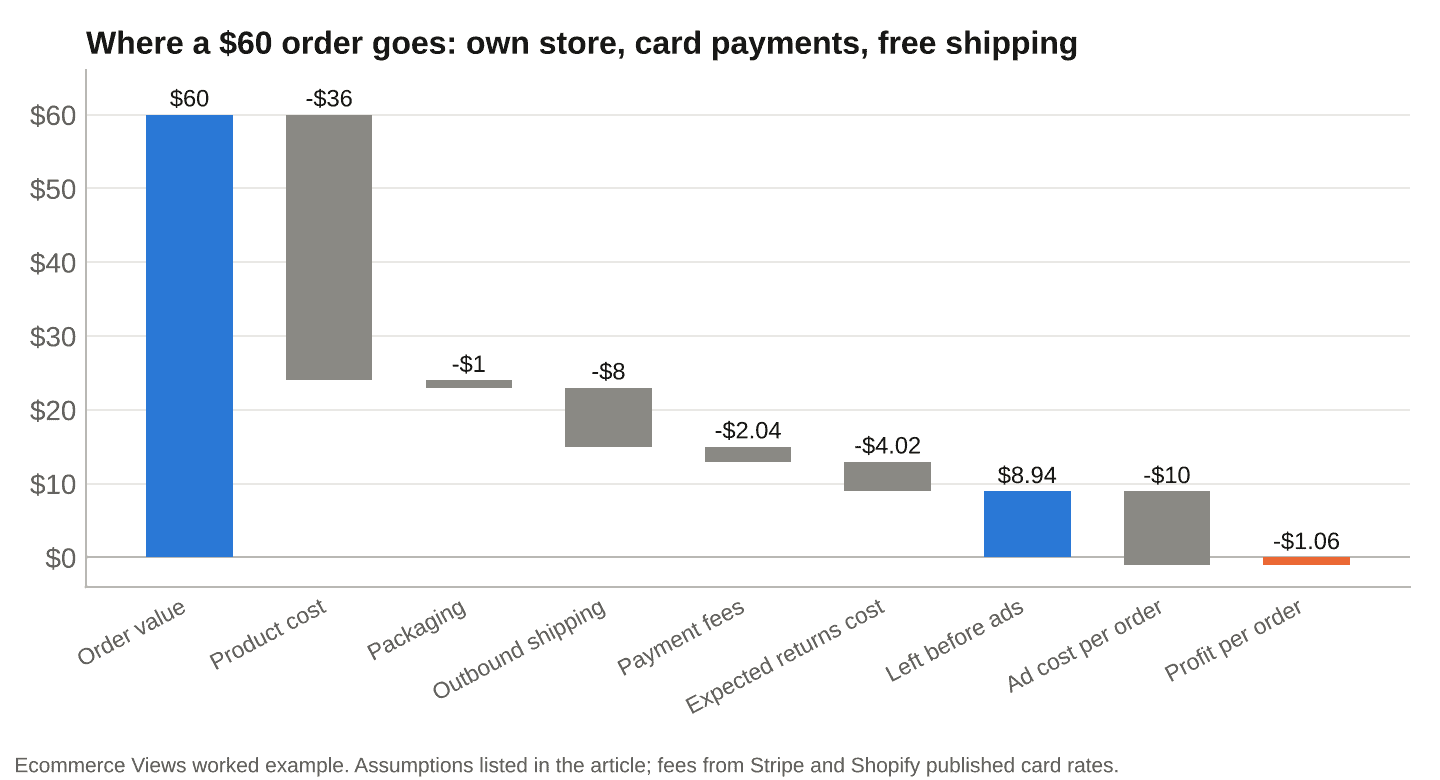
Where a $60 order goes on an own store with card payments and free shipping
After product cost, packaging, shipping, $2.04 of payment fees and $4.02 of expected returns cost, the store has $8.94 left. That is the most it can spend on advertising to win the order without losing money. At $10 of ad spend per order, each sale loses $1.06, even though the gross margin looks healthy and the ad account reports a return on ad spend of 6.0x.
That last point is the trap. A ROAS of 6.0x sounds excellent, but this order needs 6.71x just to break even, because every cost other than advertising has already eaten most of the margin.
The same order on five sales channels
Changing nothing but the channel shows how much fees decide what is left for marketing. The table keeps every cost from the example and swaps in each platform’s fees:
| Channel | Fees on a $60 order | Left before ads | Break-even ROAS | Profit at $10 ad spend |
|---|---|---|---|---|
| Own store, Stripe or Shopify Payments | $2.04 | $8.94 | 6.71x | -$1.06 |
| Own store, PayPal Checkout | $2.58 | $8.40 | 7.15x | -$1.60 |
| Etsy, US shop | $6.15 | $4.83 | 12.42x | -$5.17 |
| eBay, most categories | $8.56 | $2.42 | 24.79x | -$7.58 |
| Amazon, 15% referral category, seller ships | $9.00 | $1.98 | 30.30x | -$8.02 |
The comparison is not as one-sided as it looks. Marketplace fees pay for traffic the marketplace delivers, so a seller rarely needs to spend $10 in ads per order on Amazon or eBay to make a sale. The useful reading is the “Left before ads” column: it is the most each channel allows you to spend on promotion per order, whether that is ads, sponsored listings or discounts.
Own store
Card payments on an own store usually cost 2.9% plus 30 cents, the rate Stripe publishes and the rate Shopify lists for card payments on its base plan. Adding PayPal changes the math: PayPal Checkout costs 3.49% plus 49 cents per US transaction, which adds 54 cents to the $60 order. The own store has the lowest fees, but it is also the only channel where every visitor has to be bought, earned or brought back.
Amazon
Amazon charges a referral fee on the total sale price at a rate that depends on the category. Its published fee schedule runs from 3% to 45%, with Home and Kitchen at 15% and a 30-cent minimum in most categories, plus $39.99 a month for a Professional selling plan, which belongs in fixed costs rather than per-order fees. The preset uses the common 15% rate and assumes the seller ships; fulfillment by Amazon replaces your own shipping cost with Amazon’s fulfillment fee.
How Amazon’s economics compare with lower-price marketplaces is covered in our look at Amazon vs Temu.
Etsy
Etsy stacks three charges. Its fee policy sets a 6.5% transaction fee on the item price plus shipping and gift wrapping, Etsy Payments adds 3% plus 25 cents for US shops, and a small listing fee applies each time an item sells and relists. Together they take $6.15 from the $60 order, about 10% of the sale.
Advertising on Etsy works differently from an own store, and we covered what actually drives visibility there in our guide to Etsy SEO.
eBay
eBay’s final value fee for most categories is 13.6% of the total sale up to $7,500, then 2.35% on the portion above that, plus 40 cents per order over $10 (30 cents at $10 or less). Payment processing is included. Most sellers also get 250 free listings a month before insertion fees apply.
Which inputs move profit the most
Running the example again with one input changed at a time shows where effort pays off. Starting from a loss of $1.06 per order:
| Change | Profit per order | Improvement |
|---|---|---|
| Raise the price 10%, from $60 to $66 | $4.17 | +$5.23 |
| Cut ad spend per order from $10 to $7 | $1.94 | +$3.00 |
| Lower product cost from $36 to $33 | $1.70 | +$2.76 |
| Halve the return rate, from 10% to 5% | $0.95 | +$2.01 |
| Cut the shipping label from $8 to $6 | $0.94 | +$2.00 |
| Return rate rises to 20% | -$5.08 | -$4.02 |
Price is the biggest lever by a wide margin: a 10% increase turns the loss into a profit of $4.17, because almost all of the extra $6 falls straight to the bottom line. Stores that compete on price give up exactly this lever, which is why positioning matters so much in the economics of high-ticket ecommerce. Returns work in the opposite direction: doubling the return rate from 10% to 20% costs four dollars an order.
Break-even ROAS and the most you can spend on ads
The two advertising outputs are the most useful numbers the calculator produces, because they turn a vague goal (“profitable ads”) into a hard limit:
- Max ad spend per order is the same as “Left before ads.” In the example, any campaign that costs more than $8.94 to win a $60 order loses money on the first purchase.
- Break-even ROAS is revenue divided by that amount. The example needs 6.71x. A campaign reporting 5x is losing money on every first order, no matter how good it looks in the ad platform.
Those limits can be raised in two ways: by making each order worth more (higher price, bigger baskets, lower costs) or by making each ad dollar convert better. The second route is covered in our ecommerce conversion rate optimization guide. A repeat purchase changes the calculation too: if most customers buy again without paid promotion, a loss on the first order can be acceptable, but only if you know the repeat rate rather than hope for it.
Fixed costs and the orders needed to cover them
Per-order profit only pays the bills once fixed costs are covered. In the example, with ad spend at zero, each order leaves $8.94, so $500 a month in platform plans, apps and tools takes 56 orders to cover before the store earns anything. With $10 of ad spend per order, no number of orders ever covers it.
Fixed costs creep up quietly as a store grows: a higher platform tier, more apps, a fulfillment tool, a part-time hire. Our analysis of the total cost of ownership of scaling an online store shows how those costs compare across platforms as order volume rises.
Common mistakes when calculating profit per order
Most profit calculations that turn out wrong fail in the same few places:
- Using gross margin as profit. A 40% gross margin is a starting point, not a result.
- Forgetting free shipping is not free. If the customer pays nothing for delivery, the label comes out of your margin on every order.
- Ignoring fixed payment fees. Thirty or forty-nine cents per order is trivial on a $200 order and significant on a $15 one.
- Treating returns as cancelled sales. A returned order usually costs more than it would have if it had never been placed.
- Judging ads by platform ROAS alone. Reported ROAS ignores everything except ad spend.
- Comparing payment providers on the headline rate only. Currency conversion, cross-border and chargeback fees add up; our breakdown of payment gateway fees covers what sits behind the advertised percentage.
Run the calculator for your three best-selling products and your three most advertised ones. If any of them show a loss at your current ad spend, that is the first problem to fix, before adding a single new product or channel.