Ecommerce feels universal from the shopper’s side. Almost every product can be ordered online, and most people in Europe do order something every year. From the seller’s side, the picture is very different: most European businesses still make no sales online at all.
We analyzed Eurostat’s survey of ICT usage in enterprises, the largest regular survey of how European companies sell, whose latest round surveyed about 157,000 businesses, and covered the years 2013 to 2024. The data covers businesses with 10 or more employees across all sectors except finance, agriculture and mining, which makes it a census of established companies rather than of startups and side projects.
The short version: online selling in Europe is growing slowly, is concentrated in large companies, depends heavily on country, and is quietly shifting toward consumers.
Key findings
- 23.6% of EU businesses with 10 or more employees made ecommerce sales in 2024, up from 17.2% in 2013. That is roughly 360,000 of the EU’s 1.53 million such businesses, leaving more than 1.1 million with no online sales.
- Large companies are more than twice as likely to sell online as small ones: 48.5% of businesses with 250 or more employees against 21.4% of those with 10 to 49.
- Ecommerce brought in 19.5% of EU business turnover, but most of that came through automated EDI ordering between companies (11.1% of turnover) rather than websites and apps (8.4%).
- Consumers are taking over web sales. B2C sales were 48.2% of the value of EU businesses’ web sales in 2024, up from 33.4% in 2013.
- Marketplaces are popular but not dominant. 45.0% of businesses that sell on the web use a marketplace, yet marketplaces carry only 15.5% of web sales value.
- Country matters more than almost anything. 43.0% of businesses in Lithuania sell online, against 14.6% in Romania.
- Only 39.0% of EU retailers make ecommerce sales, and ecommerce brings in 14.9% of retail turnover.
How we analyzed the data
Eurostat publishes the results of the annual ICT usage survey, run by national statistics offices across the EU, in several tables. We used four of them: the share of businesses with ecommerce sales by company size and by industry, and the value of ecommerce sales by company size and by industry.
Two definitions matter for reading the numbers:
- Ecommerce sales are orders received over computer networks. They include web sales (through a business’s own website or app, or through an online marketplace) and EDI sales (orders placed automatically between company systems, typical in manufacturing and wholesale). Orders by manually written email do not count.
- The survey year is one year after the sales year. Each spring’s survey asks about sales made in the previous calendar year, so the 2025 survey covers 2024. Throughout this article, years refer to when the sales were made.
All figures are for the EU27 unless stated, and cover businesses with 10 or more employees.
Online selling grows by about half a point a year
Over eleven years, the share of EU businesses making ecommerce sales rose from 17.2% to 23.6%, an average gain of 0.6 percentage points a year. The growth has not been smooth:
| Sales year | Businesses with ecommerce sales | With web sales | With EDI sales | Ecommerce share of turnover |
|---|---|---|---|---|
| 2013 | 17.2% | 13.0% | 6.7% | 13.8% |
| 2016 | 20.1% | 15.7% | 7.0% | 18.4% |
| 2018 | 19.7% | 16.0% | 6.2% | 18.1% |
| 2020 | 22.3% | 19.0% | 5.7% | 19.8% |
| 2022 | 22.9% | 19.7% | 5.9% | 18.3% |
| 2023 | 23.8% | 20.6% | 6.1% | 19.1% |
| 2024 | 23.6% | 20.7% | 5.6% | 19.5% |
Three patterns stand out. Growth stalled between 2015 and 2018, when the share actually slipped. The pandemic years 2019 to 2021 delivered the biggest jump, about 3 points in three years. And since 2021 the share has crept up slowly, with a small dip in 2024.
Web sales drive all of the growth. The share of businesses using EDI has stayed between 5.6% and 7.0% for the whole period, while the share selling through websites and apps rose from 13.0% to 20.7%. In 2024, Eurostat reports that 18.0% of businesses sold only through websites or apps, 2.9% only through EDI and 2.7% through both.
Big companies sell online, small ones mostly do not
Company size is the clearest dividing line in the data.
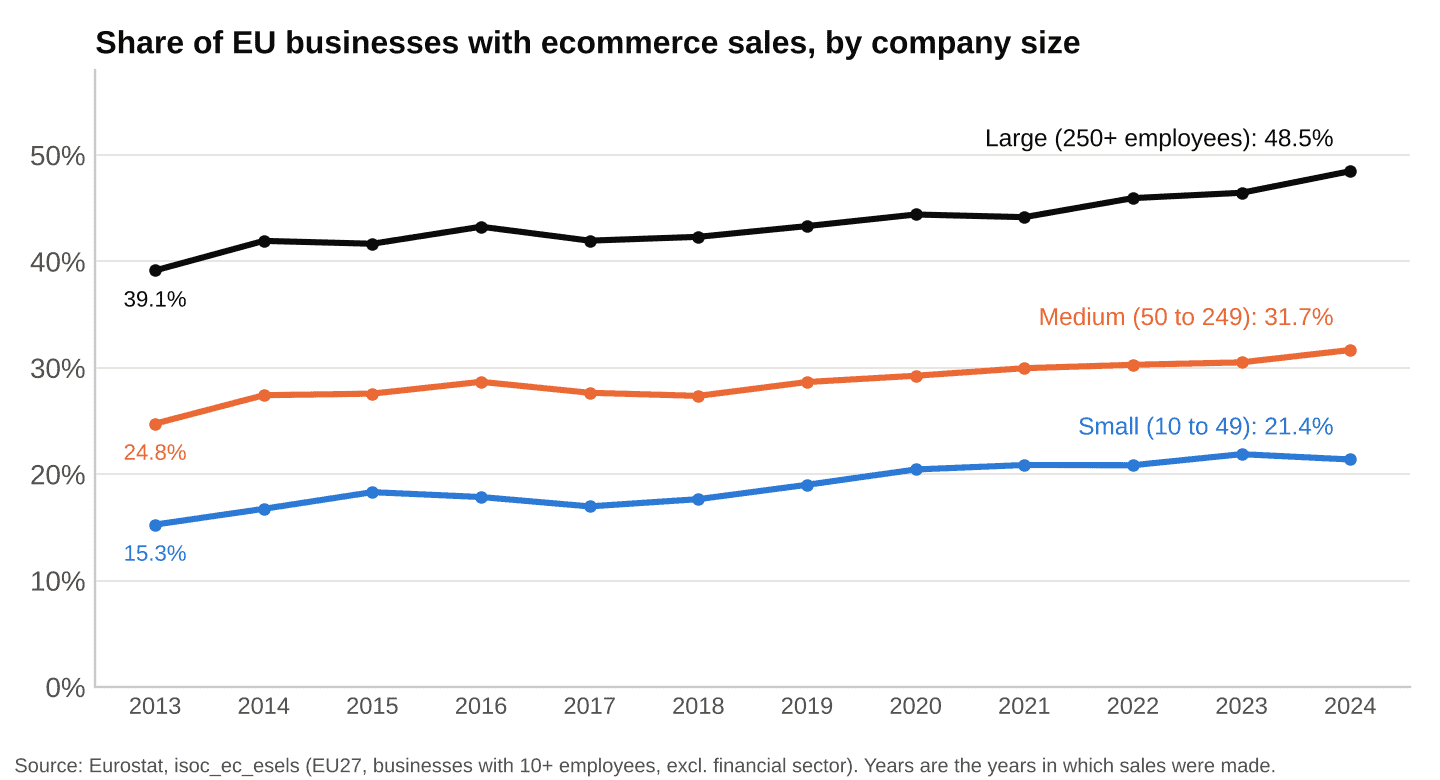
Share of EU businesses with ecommerce sales by company size, 2013 to 2024
Nearly half of large businesses (250+ employees) made ecommerce sales in 2024, against 31.7% of medium-sized businesses and 21.4% of small ones. The gap has not closed in eleven years. All three groups gained between 6.1 and 9.4 percentage points, and the share of small businesses selling online fell slightly in 2024, from 21.9% to 21.4%.
The difference is even larger in money terms. Ecommerce made up 24.2% of large businesses’ turnover in 2024, 15.4% for medium-sized businesses and 8.7% for small ones. Small businesses are 83% of EU companies with 10 or more employees, so the low adoption among them is the main reason the EU average stays below a quarter.
For a small business, the barriers are rarely technical anymore. A basic store can be running in days, and our step-by-step blueprint for building an ecommerce store covers the process. The harder questions are fulfillment, returns, customer service and whether online demand justifies the effort, which is where large companies’ scale gives them the advantage the data shows.
Most ecommerce money still flows through EDI
Ecommerce’s share of EU business turnover rose from 13.8% in 2013 to 19.5% in 2024. Most people picture websites and shopping carts when they hear “ecommerce”, but more than half of that value moves through automated ordering systems between businesses:
- EDI sales: 11.1% of total turnover in 2024
- Web sales: 8.4% of total turnover in 2024
The balance is shifting, slowly. Web sales were 4.2% of turnover in 2013 and doubled to 8.4% by 2024, including a jump of more than a point in 2024 alone. EDI’s share has stayed roughly where it was a decade ago, between 10.8% and 13.0% of turnover.
Consumers are close to half of web sales
Inside web sales, the most important long-term change is who the customers are.
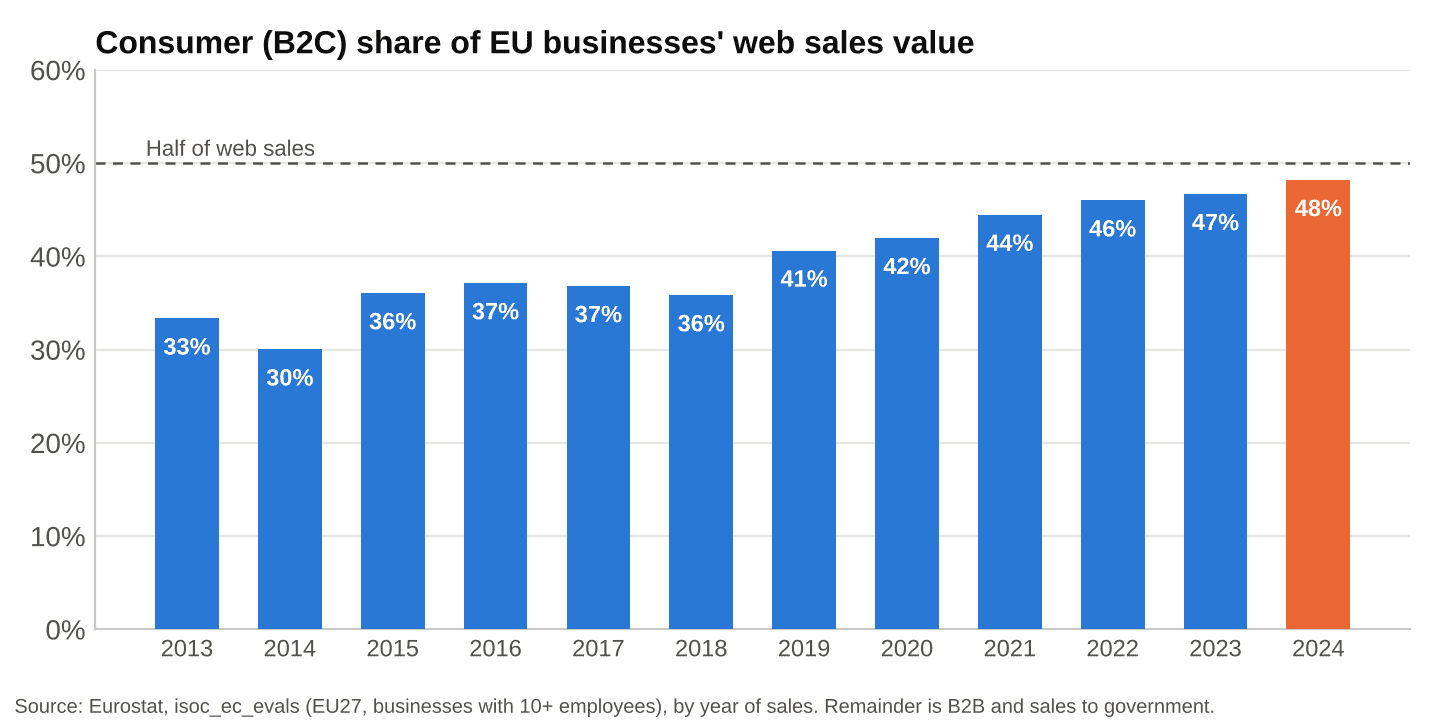
Consumer (B2C) share of EU businesses’ web sales value, 2013 to 2024
In 2013, sales to consumers made up a third of the value of EU businesses’ web sales, and sales to other businesses and governments two thirds. By 2024 the split was 48.2% B2C and 51.8% B2B and government. If the trend of the last five years continues, consumers will account for the majority of European web sales within a year or two.
The shift shows up in the number of businesses too. Among businesses with web sales, 83.0% sold to consumers in 2024, up from 74.4% in 2013, while the share selling to other businesses fell from 73.2% to 66.7%. Many businesses do both, which is why the two shares add up to more than 100%.
What Europeans actually buy as consumers is a separate question, which we answered from the shopper’s side in our study of what Europeans buy online.
Marketplaces: used by many, small in value
Marketplaces have become a standard channel for European businesses that sell online, but they have not replaced own websites. Among EU businesses with web sales in 2024:
| Channel | Share of web sellers using it | Share of web sales value |
|---|---|---|
| Own website or app | 85.7% | 84.5% |
| Online marketplace | 45.0% | 15.5% |
| Both own site and marketplace | 30.7% | |
| Marketplace only, no own site | 14.4% | 4.9% |
Marketplace use has grown from 39.7% of web sellers in 2016 to 45.0%, but marketplaces’ share of web sales value has moved much less, from 13.8% in 2016 to 15.5%. The pattern suggests many businesses use marketplaces as an extra channel that brings in a modest share of revenue, while the bulk of online sales still runs through their own site. Running several channels at once is its own discipline, covered in our guide to marketplace management.
Reliance on marketplaces varies widely by country. Among web sellers, 86.6% use marketplaces in Lithuania, 65.1% in Italy, 63.6% in Poland and 50.9% in Germany, against 27.3% in France, 24.8% in Sweden and 16.5% in Estonia.
Selling abroad: common, but most money stays at home
Cross-border selling is often presented as ecommerce’s great promise for European businesses, since one website can reach 27 countries. Many web sellers do sell abroad. In 2024:
- 43.1% of web sellers sold to customers in other EU countries
- 26.1% sold to customers outside the EU
- 44.0% sold to at least one foreign country
The money tells a more domestic story. In the latest year with value data (2023), 75.0% of EU businesses’ web sales went to customers in their own country, 16.8% to other EU countries and 6.7% to the rest of the world. Selling abroad is common, but for most businesses it is a small slice of revenue, held back by delivery costs, returns, languages and tax paperwork. The practical side of shipping across borders is covered in our guide to international shipping and customs.
Where businesses sell online: country by country
The gap between EU countries is larger than the gap between small and large businesses.
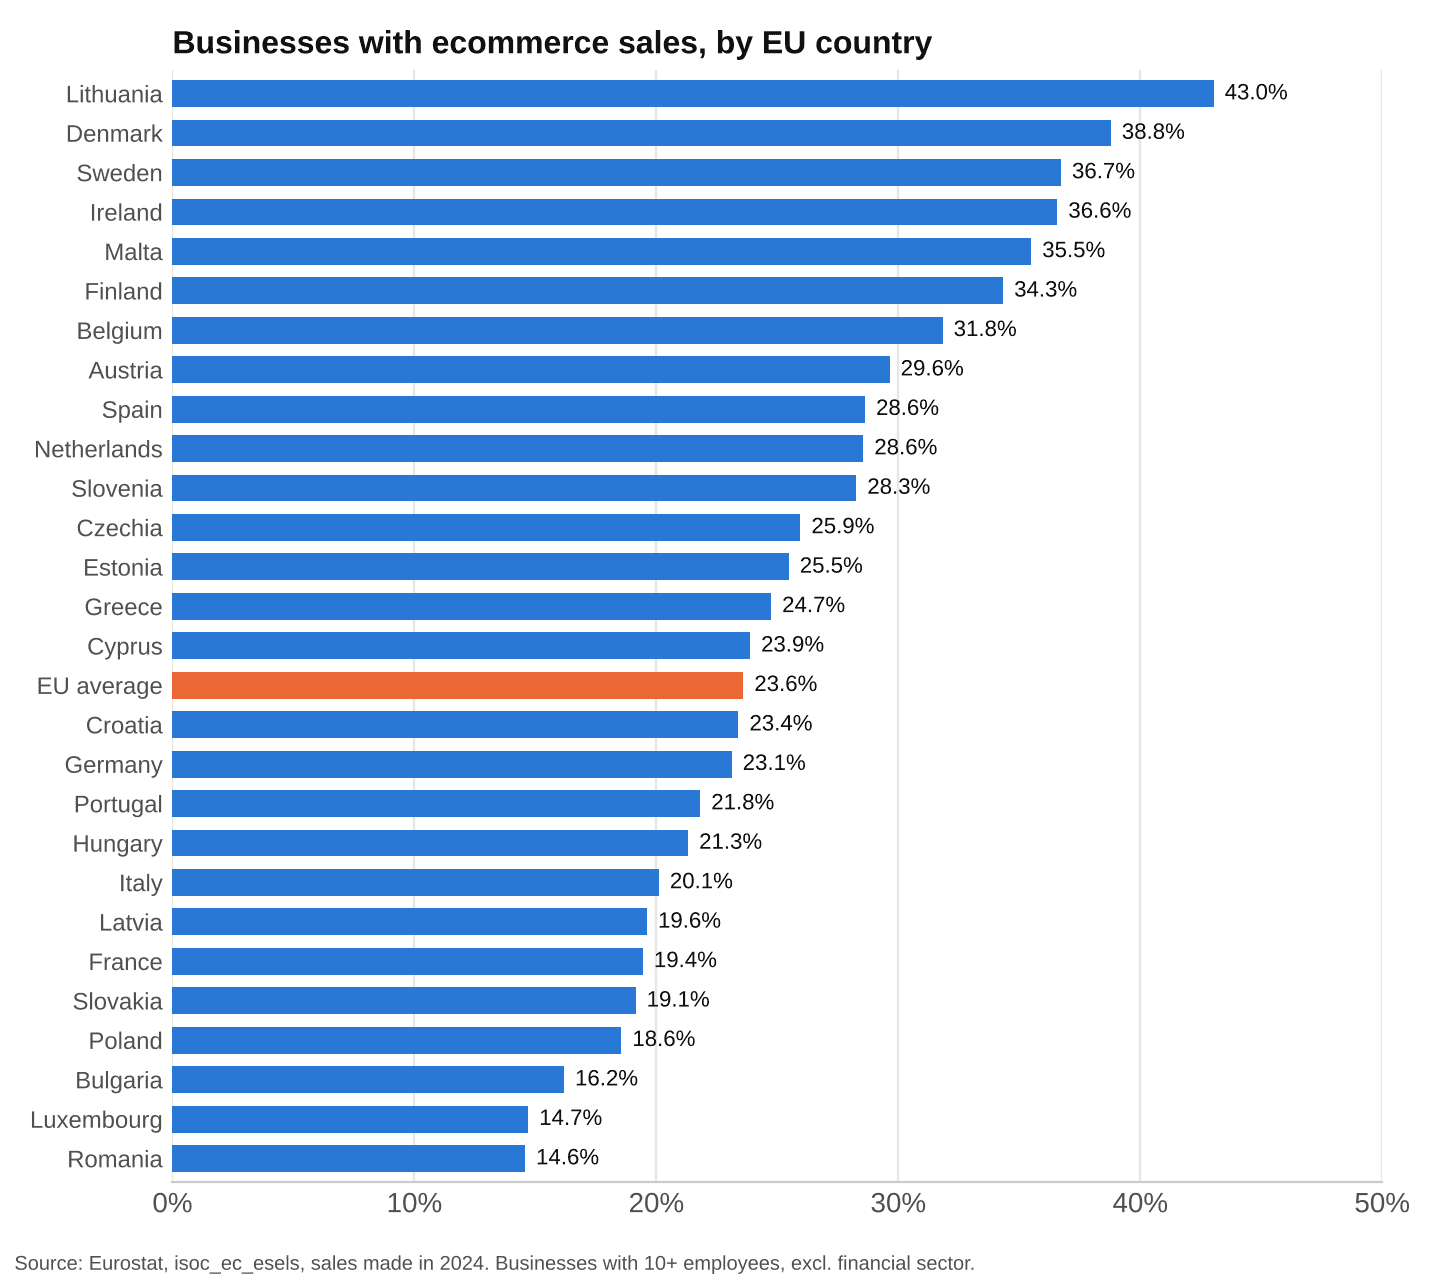
Share of businesses with ecommerce sales by EU country, 2024
Lithuania leads with 43.0% of businesses making ecommerce sales, followed by Denmark (38.8%), Sweden (36.7%), Ireland (36.6%) and Malta (35.5%). At the other end are Romania (14.6%), Luxembourg (14.7%), Bulgaria (16.2%), Poland (18.6%) and Slovakia (19.1%). Two of the EU’s largest economies sit below the average: France at 19.4% and Italy at 20.1%, while Germany is close to it at 23.1%.
The fastest change came from Lithuania, where the share rose from 25.7% in 2018 to 43.0% in 2024, a gain of 17.3 points. Ireland moved the other way, from 39.2% to 36.6%, although Irish businesses still earn the highest share of turnover from ecommerce in the EU, at 38.3%, and the highest from web sales alone, at 25.2%.
For businesses selling across Europe, these numbers indicate where competition online is already dense and where many local businesses have yet to move online. How Europe as a whole compares with other parts of the world is covered in our overview of ecommerce by region.
Which industries sell online
Adoption by industry follows how customers buy. Where people book or reorder without needing to see the seller, online selling is close to universal; where every job is custom, it is rare.
| Industry | Businesses with ecommerce sales | Ecommerce share of turnover | Web sales share of turnover |
|---|---|---|---|
| Accommodation | 78.3% | 44.0% | 40.5% |
| Travel agencies and tour operators | 58.8% | 49.6% | 46.6% |
| Wholesale trade | 41.4% | 24.9% | 9.5% |
| Retail trade | 39.0% | 14.9% | 12.1% |
| Food and drink manufacturing | 34.2% | 30.3% | 3.0% |
| Information and communication | 25.4% | 22.7% | 17.0% |
| Manufacturing (all) | 21.6% | 23.3% | 5.2% |
| Real estate | 13.9% | 3.3% | 2.6% |
| Professional and technical services | 9.3% | 5.4% | 2.6% |
| Construction | 6.2% | 2.2% | 0.8% |
EU27, sales made in 2024, businesses with 10 or more employees.
Two results deserve attention. First, manufacturers and wholesalers get a large share of turnover from ecommerce, but almost all of it comes through EDI rather than the web: food manufacturers earn 30.3% of turnover through ecommerce and just 3.0% through web sales. Second, retail, the sector most associated with ecommerce, is far from fully online. Only 39.0% of EU retailers with 10 or more employees made any ecommerce sales in 2024, and 87.1% of retailers’ web sales value came from consumers.
What the data means for online sellers
For businesses selling online in Europe, or planning to, the data points to a few practical conclusions:
- The market is far from saturated. More than three quarters of established EU businesses do not sell online, including six in ten retailers. In many sectors and countries, an online presence is still a differentiator.
- B2C growth is the main web trend. Consumers are close to half of web sales value and gaining every year. Businesses that sell only to other businesses can add a consumer channel.
- Do not depend on marketplaces alone. Marketplace-only sellers are 14.4% of web sellers but take 4.9% of web sales value. An own website remains where most online revenue is made.
- Treat cross-border sales as an add-on. Three quarters of web sales value stays in the seller’s home country. Win at home first, then expand to the neighboring markets most like it.
- Choose countries with the data in mind. In Romania, Bulgaria, Poland and Slovakia, fewer than one in five businesses sell online, while Lithuania and the Nordic countries are crowded.
For businesses weighing whether the effort pays off, our overview of how ecommerce benefits a business sets out the commercial case.
Limits of the data
The Eurostat survey is the most consistent source on European business ecommerce, but it has boundaries, which Eurostat sets out in its ecommerce statistics overview:
- Businesses with fewer than 10 employees are excluded from the EU totals, so micro businesses and sole traders, including many small online stores, are not counted.
- The financial sector, agriculture and mining are excluded.
- Sales values are shares of turnover, not euro amounts, so the data shows how important ecommerce is to businesses rather than the total size of the market.
- The survey is a sample. Small year-to-year changes, such as the 0.2-point dip in 2024, are within normal survey variation and should not be read as a trend on their own.
- Some indicators are not collected every year. Cross-border sales values, for example, are only available for selected years.
Eurostat plans its next update of these statistics, covering sales made in 2025, for early 2027.