Most ecommerce statistics about Europe come from payment companies, marketplaces or agencies, each measuring its own slice of the market. There is one source that asks the people themselves, in every EU country, with the same questions every year: Eurostat’s survey on how households and individuals use the internet. It asks whether people bought anything online, how often, and what kinds of goods and services they bought.
We analyzed six years of it, from 2020 to 2025, across the 27 EU member states. The reasons people shop online have been covered at length, including in our look at why ecommerce is popular. This piece is about something more useful to a seller: who is actually buying, which categories are gaining and losing, and how different the 27 markets really are.
Key findings
- 73.6% of EU residents aged 16 to 74 bought something online in the past year in 2025, up from 64.7% in 2020. Another 15.3% have never bought anything online.
- Older shoppers drove the growth. The share of 65 to 74 year olds buying online rose by 11.9 percentage points to 44.4%, and 55 to 64 year olds by 12.9 points, about twice the gain among 16 to 24 year olds.
- Beauty, hygiene and sports goods grew fastest. Measured against the whole population, online buyers of cleaning and personal hygiene products rose 37%, sports goods 37% and cosmetics 35% between 2020 and 2024, while online buyers of computers and phones fell 1%.
- Online grocery barely moved. The share of online shoppers buying food from stores slipped from 18.8% to 18.2%, while restaurant delivery climbed to 32.9%.
- The gap between countries is enormous. In 2025, 95.1% of people in Ireland bought online, against 51.2% in Bulgaria. Germany was the only EU country where the share fell over five years.
How we analyzed the data
The data comes from Eurostat’s annual survey on ICT usage in households and by individuals, which covers people aged 16 to 74 in all member states. We used two tables. The first measures whether and how often people bought online and runs to 2025. The second records the categories people bought in the three months before the interview and, at the time of writing, runs to 2024. All figures here refer to the EU of 27 countries unless a country is named.
Two definitions matter when reading the results:
- “Bought online in the past year” is a share of all residents aged 16 to 74, internet users or not.
- Category figures are shares of people who bought anything online in the previous three months, so they show what online shoppers buy, not how much they spend. Where we compare growth over time, we also measure categories against the whole population, which removes the effect of more people shopping online overall.
Finding 1: The north is saturated, the south and east are catching up
In 2020, four EU countries with comparable data had at least 80% of residents buying online in a year. By 2025 there were nine: Ireland, the Netherlands, Denmark, Sweden, Czechia, Finland, Germany, France and Luxembourg. The latest country figures are available in Eurostat’s online purchases table.
| Country | Bought online in past year, 2020 | 2025 | Change, points |
|---|---|---|---|
| Ireland | 74.4% | 95.1% | +20.7 |
| Netherlands | 86.6% | 94.2% | +7.6 |
| Denmark | 89.3% | 91.2% | +1.9 |
| Germany | 82.6% | 81.4% | -1.2 |
| EU 27 | 64.7% | 73.6% | +8.8 |
| Greece | 46.4% | 68.0% | +21.6 |
| Croatia | 55.0% | 61.7% | +6.7 |
| Romania | 37.9% | 60.3% | +22.4 |
| Italy | 43.9% | 56.2% | +12.3 |
| Bulgaria | 31.0% | 51.2% | +20.2 |
The biggest gains came from markets that started low. Romania added 22.4 points, Greece almost 22, and Bulgaria and Ireland around 20 each. At the other end, Germany slipped from 82.6% to 81.4%, the only decline among the 27, while Denmark and Luxembourg gained less than two points. Where most people already shop online, growth now has to come from spending more per person rather than from new buyers.
Finding 2: The growth came from older people
The age data holds the clearest single trend in the survey. Every age group bought online more in 2025 than in 2020, but the biggest gains came from people over 45.
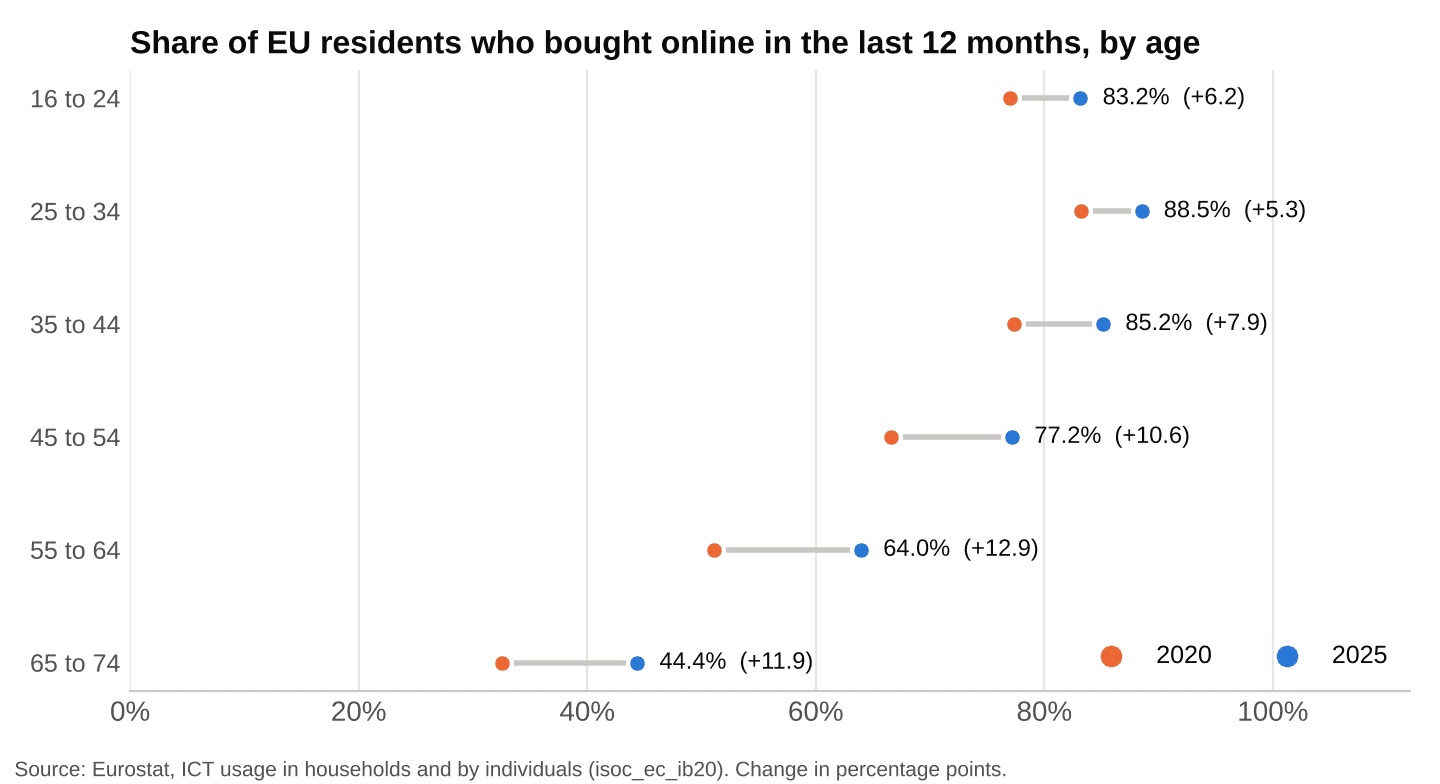
Share of EU residents who bought online in the last 12 months, by age, 2020 and 2025
Young adults were already near their ceiling: 83.2% of 16 to 24 year olds and 88.5% of 25 to 34 year olds bought online in 2025. Among 55 to 64 year olds the share rose from 51.1% to 64.0%, and among 65 to 74 year olds from 32.5% to 44.4%. Even so, 29.2% of the oldest group have still never bought anything online, the widest gap left in any age group.
Men and women now buy online at almost exactly the same rate, 73.9% against 73.2%. Older first-time buyers tend to rely heavily on signals they can check before paying, which is why clear returns terms and visible reviews carry extra weight with them, a point covered in our analysis of how online reviews influence purchases.
Finding 3: Clothes dominate, and everything else is a long way behind
Clothing, shoes and accessories are bought by seven in ten online shoppers in a typical three-month period, more than twice the share of any other category. The rest of the list is surprisingly flat, with ten categories clustered between 18% and 33%. The full category detail sits in Eurostat’s goods and services table.
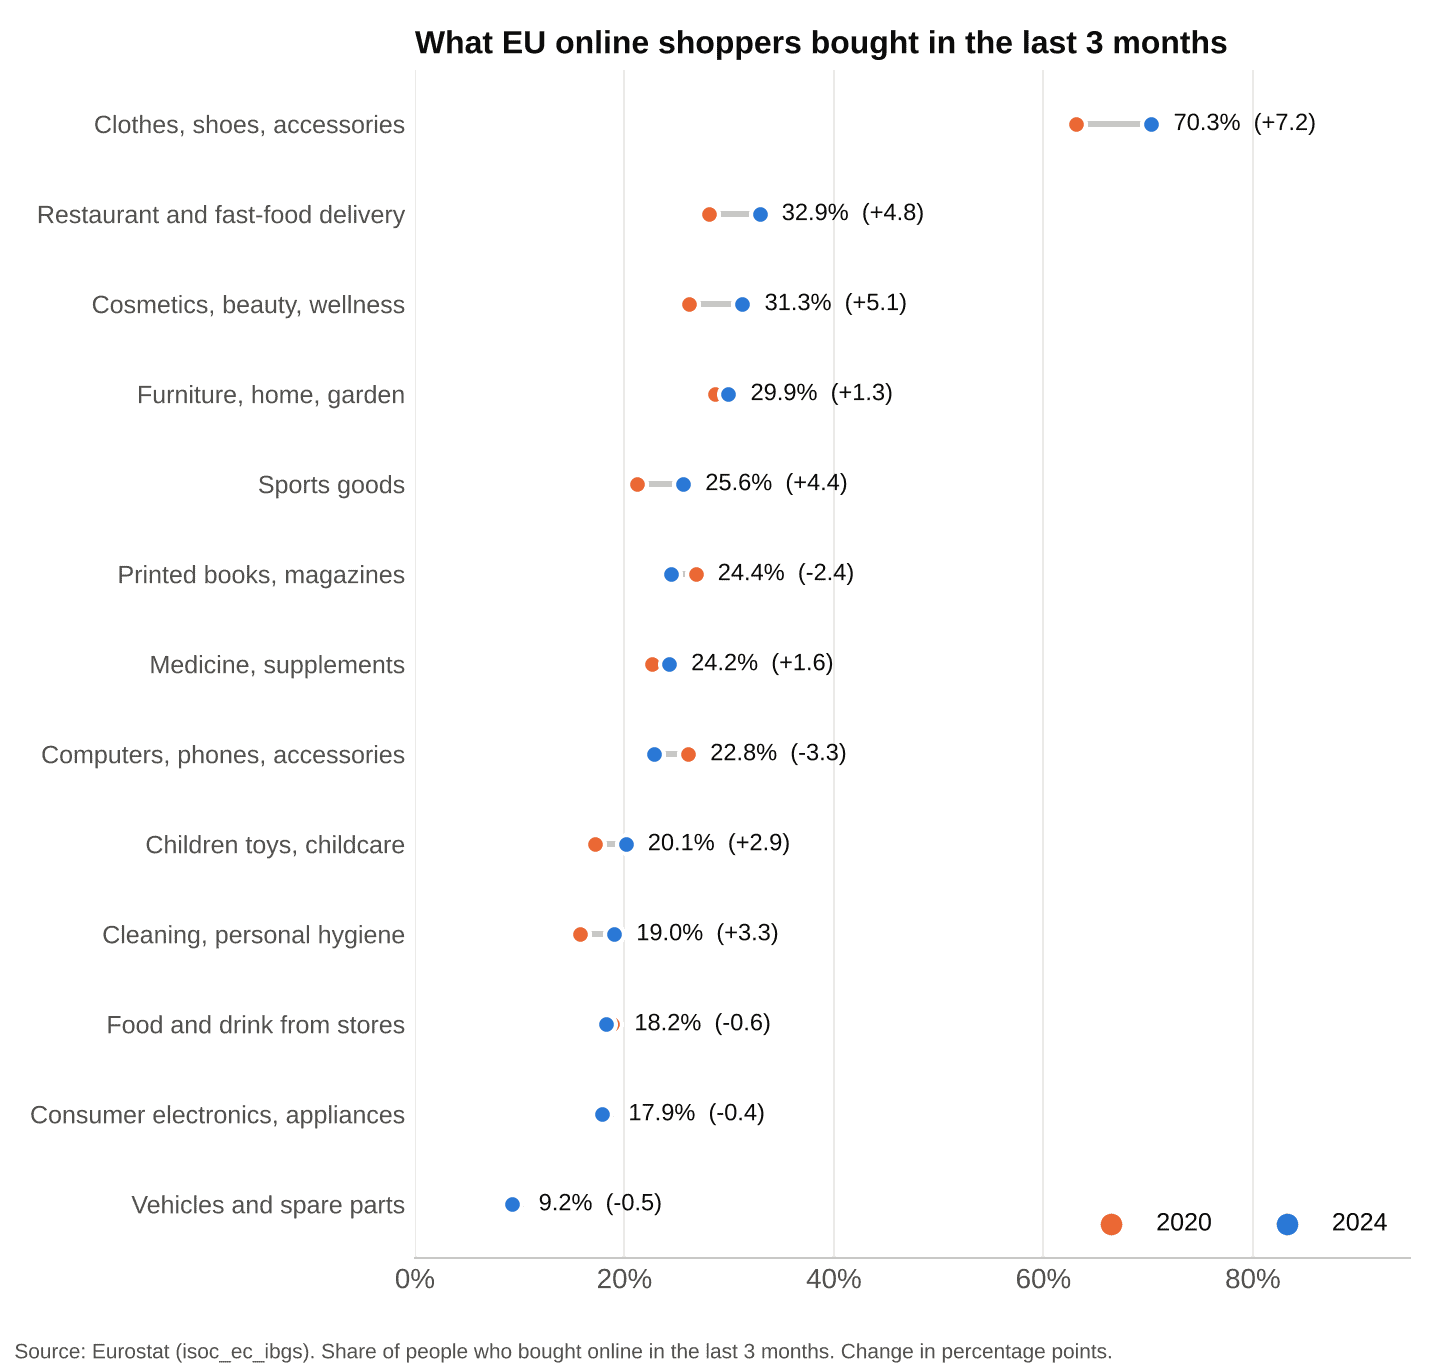
What EU online shoppers bought in the last 3 months, 2020 and 2024
In 2024, the most bought categories among EU online shoppers were:
- Clothes, shoes and accessories: 70.3%, up 7.2 points since 2020
- Restaurant and fast-food delivery: 32.9%, up 4.8 points
- Cosmetics, beauty and wellness: 31.3%, up 5.1 points
- Furniture, home and garden: 29.9%, up 1.3 points after dipping to 26.2% in 2022 and 2023
- Sports goods: 25.6%, up 4.4 points
- Printed books and magazines: 24.4%, down 2.4 points
- Computers, phones and accessories: 22.8%, down 3.2 points
Finding 4: The shift is toward things people run out of
Shares of online shoppers can hide growth, because the pool of shoppers itself grew. Measuring each category against the whole population aged 16 to 74 shows which ones really gained ground:
| Category | Share of population buying online, 2020 | 2024 | Relative change |
|---|---|---|---|
| Cleaning and personal hygiene | 8.4% | 11.4% | +37% |
| Sports goods | 11.3% | 15.4% | +37% |
| Cosmetics, beauty and wellness | 13.9% | 18.8% | +35% |
| Restaurant delivery | 14.9% | 19.8% | +33% |
| Clothes, shoes and accessories | 33.5% | 42.3% | +26% |
| Medicine and supplements | 12.0% | 14.6% | +22% |
| Consumer electronics and appliances | 9.7% | 10.8% | +11% |
| Food and drink from stores | 10.0% | 11.0% | +10% |
| Printed books and magazines | 14.2% | 14.7% | +3% |
| Computers, phones and accessories | 13.8% | 13.7% | -1% |
The fastest growers are consumables bought again and again, not big-ticket items bought once every few years. Electronics and computers, the categories that built early ecommerce, have flatlined. For a new store, that pattern supports a simple rule we made the case for in our piece on starting with $1,000: sell what people run out of, not what is trending.
Finding 5: Online grocery never took off in most of Europe
Food from supermarkets and meal kits is the category where online shopping has made the least progress. In 2024, 18.2% of EU online shoppers bought groceries online in a three-month period, slightly fewer than in 2020. Restaurant and fast-food delivery, by contrast, reached 32.9%.
The national picture is extremely uneven:
- Highest grocery shares: Malta 39.5%, Czechia 28.8% and the Netherlands 28.2% of online shoppers
- Lowest grocery shares: Croatia 6.9% and Slovenia 8.1%
- Highest restaurant delivery shares: Cyprus 78.8%, Malta 75.5% and Greece 63.9%
- Lowest restaurant delivery shares: France 19.2% and Italy 17.8%
Europeans are happy to have a cooked meal brought to the door but still prefer to choose their own vegetables. For anyone selling food online outside a few dense markets, that argues for specialty and shelf-stable products over everyday groceries.
Finding 6: Age and gender decide what goes in the basket
The categories people buy online change sharply with age. Comparing the youngest adults, the core 25 to 34 group and the oldest group in 2024:
| Share of online shoppers buying, 2024 | Age 16 to 24 | Age 25 to 34 | Age 65 to 74 |
|---|---|---|---|
| Clothes, shoes and accessories | 76.7% | 75.6% | 51.0% |
| Restaurant delivery | 41.7% | 48.1% | 11.2% |
| Cosmetics and beauty | 31.1% | 34.6% | 21.3% |
| Furniture, home and garden | 16.2% | 32.3% | 29.2% |
| Medicine and supplements | 13.8% | 25.1% | 27.7% |
| Printed books and magazines | 21.3% | 24.2% | 25.1% |
| Computers and phones | 24.6% | 25.0% | 16.1% |
Older online shoppers are twice as likely as the youngest to buy medicine and supplements, and nearly twice as likely to buy furniture. Toys and childcare items peak at 35.3% among 35 to 44 year olds, the parenting years.
Gender differences are just as large. Women are far more likely to buy cosmetics online (43.6% against 18.5% of men) and clothing (78.8% against 61.5%), as well as medicine and supplements (28.1% against 20.3%). Men lead in computers and phones (28.9% against 16.9%), consumer electronics (23.3% against 12.6%) and vehicles and spare parts (14.5% against 4.2%). Segments this different respond to different product mixes and messages, which is where AI personalization earns its keep for stores selling across several categories.
Finding 7: Every market has its own specialty
Country leaders by category show how different the 27 markets are, even when overall online buying rates look similar. Among online shoppers in 2024:
- Sweden leads medicine and supplements by a wide margin, at 48.3%, more than four times France’s 11.2%.
- Cyprus leads clothing (85.3%) and computers and phones (53.4%).
- Italy leads furniture and home goods at 38.1%, despite having one of the lowest overall online buying rates.
- The Netherlands leads sports goods (36.7%) and cleaning and hygiene products (30.3%).
- Ireland leads cosmetics (41.8%) and printed books (32.9%).
- Finland leads vehicles and spare parts at 19.2%.
A product that sells in one market can be a niche in the next. Before expanding into another EU country, check that the category is actually bought online there, and plan for the delivery and duty differences covered in our guide to international shipping and customs.
Finding 8: More shoppers, but heavy buyers remain a minority
Frequency has risen only slightly. In 2025, 15.3% of EU online shoppers made more than ten online purchases in three months, up from 13.8% in 2020, while a third (34.2%) made only one or two. Heavy buying is concentrated in a few markets: Malta (33.0% of online shoppers), Ireland (23.7%) and the Netherlands (22.2%), against 8.7% in Italy and 5.7% in Romania.
Services are an increasingly large part of what people buy online. Among online shoppers in 2025, 49.2% paid for a film, series or sports streaming subscription, 42.9% bought event tickets, 42.1% bought transport services and 37.9% booked accommodation. Eurostat’s own summary of e-commerce statistics for individuals tracks these service categories alongside physical goods.
What this means for sellers in Europe
The six-year view points to a few clear priorities for anyone selling to EU consumers:
- Design for older customers. People over 55 are the fastest-growing group of online shoppers and the largest untapped one, and they over-index on medicine, furniture and books.
- Favor replenishment categories. Beauty, hygiene, sports and supplements grew far faster than electronics and computers, and they bring repeat orders.
- Pick countries by category, not by headline rate. Italy is a weak online market overall but the strongest for furniture; Sweden leads supplements.
- Treat Germany as mature and Southeast Europe as growing. Penetration in Romania, Bulgaria and Greece rose by around 20 points in five years.
- Be cautious with online grocery outside Malta, Czechia and the Netherlands.
Platform choice matters too when selling across many EU markets with different languages, taxes and payment habits, and our comparison of PrestaShop and OpenCart looks at two platforms with deep European roots.
Limitations of the data
The survey measures people, not money. A rising share of online shoppers buying a category does not mean spending in that category rose by the same amount, and one person buying twenty items counts the same as one buying a single item. Category questions refer to the three months before the interview, so seasonal categories such as toys may be under or overstated depending on when each country runs its fieldwork. Category detail for 2025 had not been published at the time of writing, which is why the category analysis ends in 2024. France has no comparable figure for 2020, so it is excluded from comparisons with that year, and the United Kingdom has not been covered since 2020, rankings.