Selling Online Is No Longer Cheaper Than Running a Store: What 11 Years of Census Data Show
One of the oldest arguments for ecommerce is that it is cheaper to run. No rent on prime retail space, no shop staff, no tills, no fitting rooms: an online store should keep more of every dollar than a shop on the high street. For a while, the numbers backed that up.
They no longer do. We analyzed eleven years of operating data that US retailers report to the Census Bureau, comparing online and mail-order retailers with stores that sell the same kinds of goods. In 2012, online retailers spent less to run their business per dollar of sales than comparable stores. By 2022 they spent 3.5 cents more, and most of the profitability gap between the two had closed.
This study sets out what the Census data shows, where the costs have gone and what it means for anyone running an online store today.
Key findings
- Online retailers spent 28.9 cents of every sales dollar on operating expenses in 2022, up from 25.5 cents in 2012.
- Comparable stores went the other way, from 27.5 cents to 25.4 cents. Online retail has been the more expensive model to operate, per dollar of sales, every year since 2014.
- Online operating expenses grew faster than sales. From 2012 to 2022, online retailers’ sales grew 229% and their operating expenses 274%. Stores’ sales grew 32% and their operating expenses 22%.
- The profit advantage has mostly gone. After operating expenses, online retailers kept 10.6% of sales in 2022 against 9.3% for comparable stores. In 2012 the figures were 12.2% and 6.1%.
- Online retailers’ higher gross margin is what keeps them ahead. They take in more per dollar of sales than stores, then spend almost all of the difference running the business.
- Inventory is no lighter online. Online retailers held 54 days of inventory at the end of 2022, close to the 53 days of retail overall excluding car dealers.
How we analyzed the data
The data comes from the Census Bureau’s Annual Retail Trade Survey, which collects sales, purchases, inventories and operating expenses from US retail companies every year. We used the 2022 benchmarked tables, which run from 2012 to 2022. 2022 is the final year of this series: the survey has since been folded into the Census Bureau’s Annual Integrated Economic Survey.
We compared two groups:
- Online and mail-order retailers (NAICS 4541, “electronic shopping and mail-order houses”): businesses that sell mainly through websites, apps and catalogs rather than stores.
- GAFO stores: the Census grouping of store retailers that sell general merchandise, apparel, furniture and other goods typically sold online, covering general merchandise, clothing, furniture and home furnishings, electronics and appliances, sporting goods, hobby and book stores, and office supply and gift stores.
For each group and year, we calculated three ratios, all as a share of sales:
- Gross margin: sales minus the cost of the goods sold
- Operating expenses: the costs of running the business other than buying the merchandise, such as payroll and benefits, rent, advertising, technology, depreciation and other overheads
- Margin left after operating expenses: gross margin minus operating expenses, a proxy for operating profit before interest and tax
All values are in current dollars, and the online group covers both pure online sellers and catalog retailers. Because the largest online retailers make up a large part of the total, these are industry-wide ratios, not the figures for a typical small store.
Online retail has become the more expensive model to run
In 2012, an online retailer spent 25.5 cents on operating expenses for every dollar of sales, two cents less than a comparable store. By 2022, the positions had reversed.
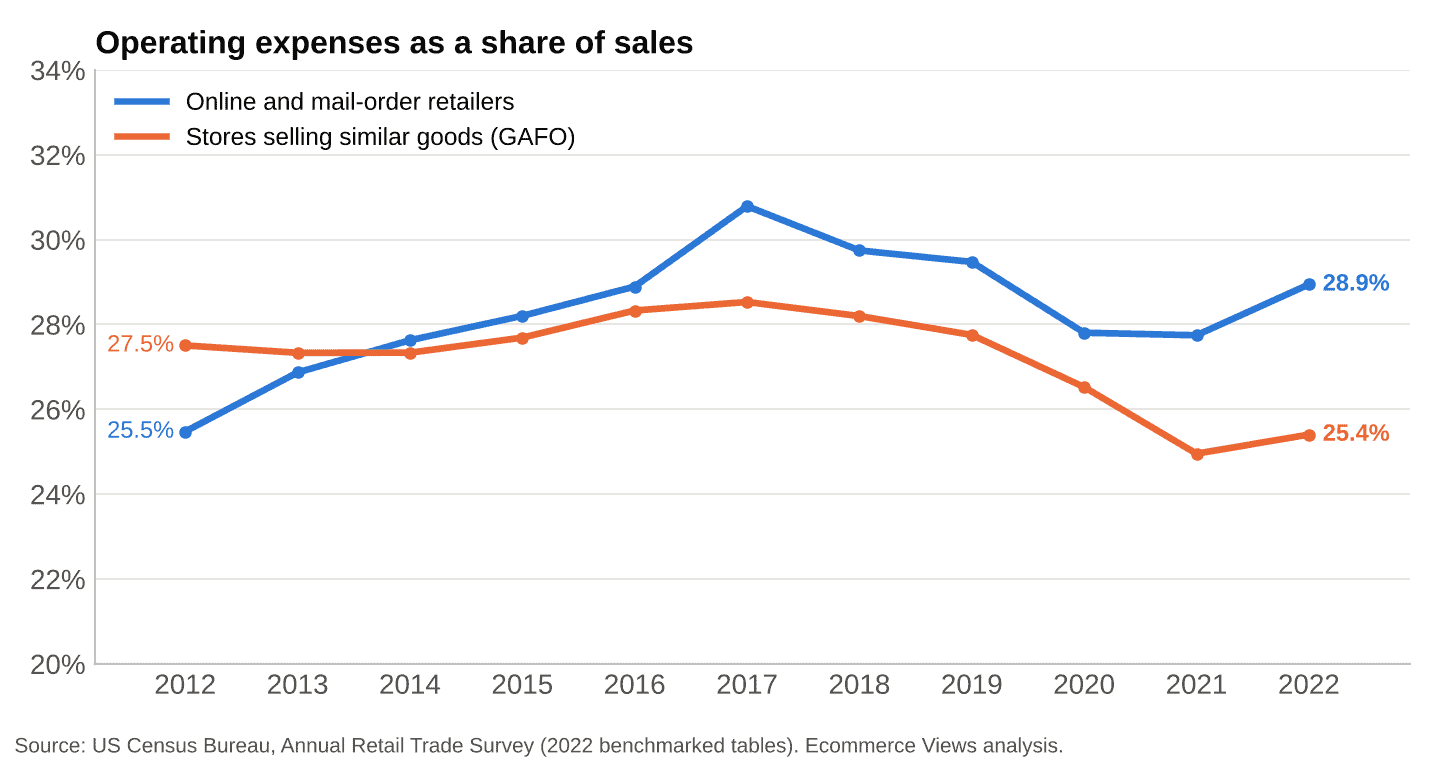
Operating expenses as a share of sales, online retailers and comparable stores, 2012 to 2022
The lines crossed in 2014. Online retailers’ operating expense ratio kept climbing to a peak of 30.8% in 2017, eased during the pandemic years as sales surged, and rose again to 28.9% in 2022 as growth slowed. Comparable stores, meanwhile, ran leaner almost every year after 2017 and reached 25.4% in 2022.
The underlying growth rates explain the divergence:
| Online and mail-order retailers | GAFO stores | |
|---|---|---|
| Sales growth, 2012 to 2022 | +229.0% | +32.2% |
| Operating expense growth, 2012 to 2022 | +273.7% | +22.1% |
| Operating expenses, 2022 | $307.5 billion | $394.8 billion |
| Operating expenses as share of sales, 2022 | 28.9% | 25.4% |
Online sales more than tripled, but the cost of running online businesses grew even faster. Stores grew slowly and cut costs harder than they grew. In 2012, online retailers’ operating expenses were about a quarter of what GAFO stores spent; by 2022, they were close to four fifths. Technology is one of the costs that keeps rising with scale, as our analysis of the total cost of ownership of open-source commerce shows.
Where the cost advantage went
The Census tables report total operating expenses rather than each cost line, so they show the size of the shift rather than its exact sources. But the categories that sit inside operating expenses point to where online costs grow with every order, in a way that store costs do not:
- Fulfillment labor and warehousing. A store customer picks, carries and takes home their own goods. Online, the retailer pays people or machines to do it, for every order. The case for automating that work is laid out in our piece on warehouse automation in supply chain management.
- Customer acquisition. A shop on a busy street gets passing trade. An online store has to buy or earn almost every visit, and the cost of that attention has risen as more sellers compete for it.
- Technology. Platforms, apps, hosting, payments infrastructure and the people to run them are a fixed and growing cost of being online.
- Returns handling. Online orders come back more often than store purchases, and each return carries processing and handling costs.
Store retailers, by contrast, spent the decade closing underperforming locations, reducing staff per square foot and turning stores into pickup and fulfillment points. Their operating expense ratio fell from 28.5% in 2017 to 25.4% in 2022.
The profit gap has almost closed
Operating costs only tell half the story, because online retailers also earn a higher gross margin on what they sell. Subtracting operating expenses from gross margin shows how much of each sales dollar is left as a rough operating profit.
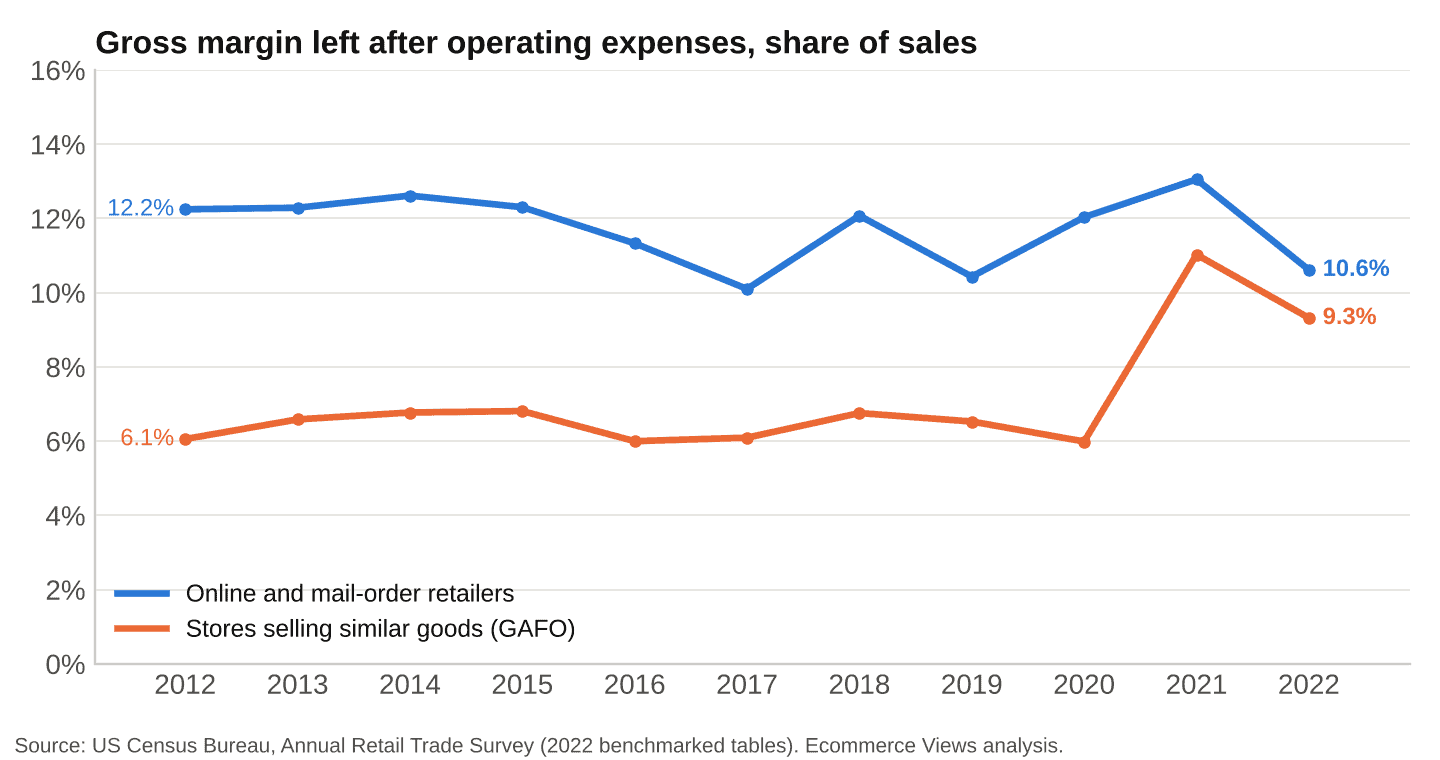
Gross margin left after operating expenses, online retailers and comparable stores, 2012 to 2022
For most of the decade, online retailers kept far more of each dollar than comparable stores: 12.2 cents against 6.1 cents in 2012, and 10.4 cents against 6.5 cents in 2019. Then the gap narrowed sharply:
| Year | Online retailers | GAFO stores | Online advantage |
|---|---|---|---|
| 2012 | 12.2% | 6.1% | 6.2 points |
| 2015 | 12.3% | 6.8% | 5.5 points |
| 2017 | 10.1% | 6.1% | 4.0 points |
| 2019 | 10.4% | 6.5% | 3.9 points |
| 2020 | 12.0% | 6.0% | 6.0 points |
| 2021 | 13.1% | 11.0% | 2.0 points |
| 2022 | 10.6% | 9.3% | 1.3 points |
Gross margin minus operating expenses, as a share of sales. Differences calculated before rounding.
Two things happened at once after 2020. Stores became much more profitable: GAFO stores’ gross margin rose to 36.0% in 2021 as they sold more at full price, while their operating costs fell. And online retailers lost ground as their costs climbed back after the pandemic surge. In 2022 the online advantage was 1.3 percentage points, the smallest in the series. Rising acquisition costs are a likely part of the story, and most merchants admit they cannot tell whether that spend pays off, as we found in why only 7% of ecommerce merchants feel confident about their marketing spend.
Online retailers still earn more gross margin per dollar than stores, between 37.7% and 41.8% of sales in every year of the decade, against 34.7% for GAFO stores in 2022. Almost all of that advantage is now spent running the business.
How online compares with every type of store
Online retailers sit in the middle of the pack rather than at the top when compared with individual store types:
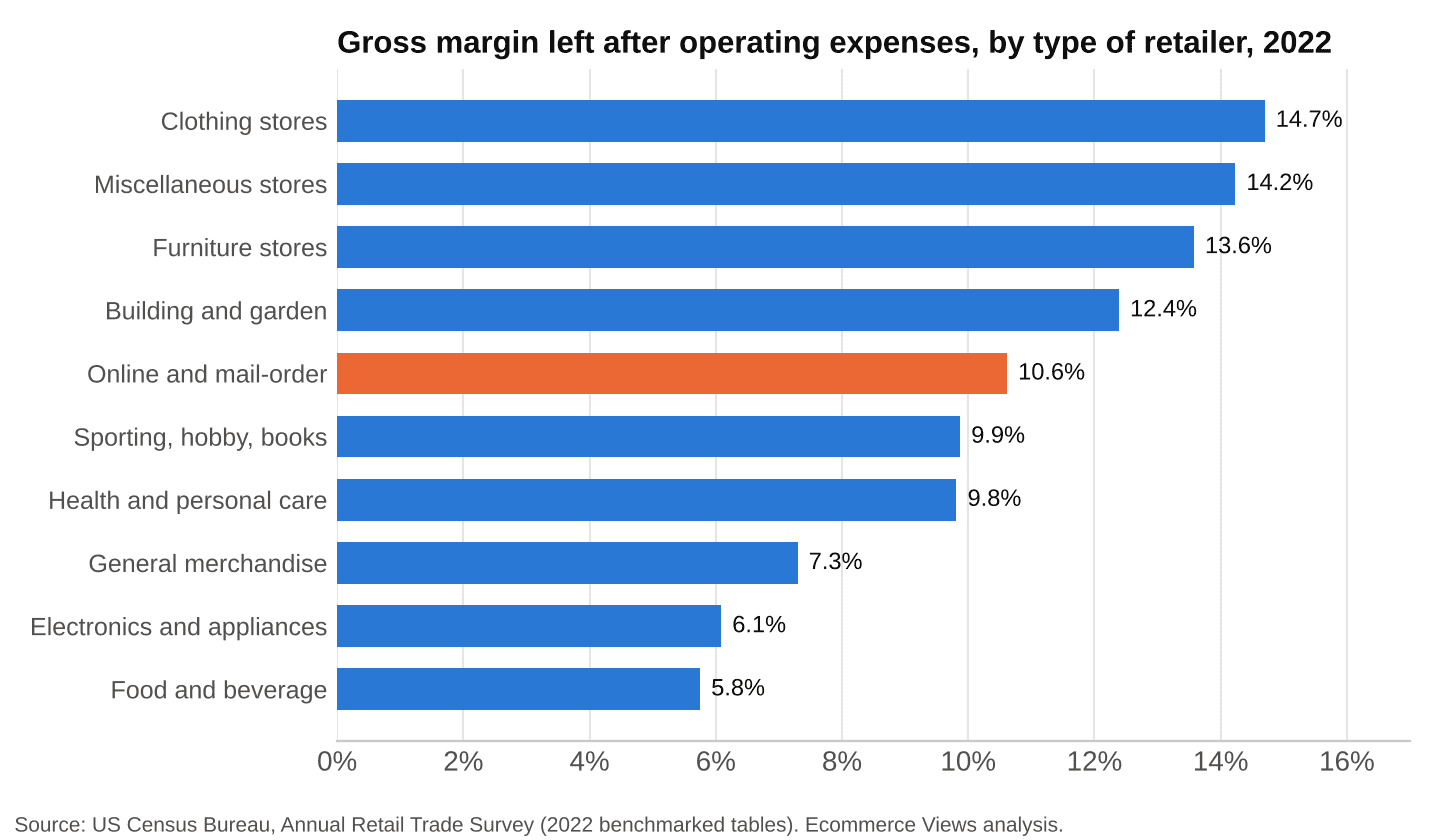
Gross margin left after operating expenses by type of retailer, 2022
| Type of retailer | Gross margin | Operating expenses | Left after operating expenses | Days of inventory |
|---|---|---|---|---|
| Clothing stores | 49.6% | 34.9% | 14.7% | 129 |
| Miscellaneous stores | 53.6% | 39.4% | 14.2% | 108 |
| Furniture stores | 51.0% | 37.4% | 13.6% | 118 |
| Building and garden | 35.6% | 23.2% | 12.4% | 92 |
| Online and mail-order | close to 40% | 28.9% | 10.6% | 54 |
| Sporting, hobby, books | 45.2% | 35.3% | 9.9% | 156 |
| Health and personal care | 32.9% | 23.1% | 9.8% | 52 |
| General merchandise | 26.8% | 19.5% | 7.3% | 54 |
| Electronics and appliances | 29.4% | 23.3% | 6.1% | 62 |
| Food and beverage | 28.7% | 22.9% | 5.8% | 33 |
US Census Bureau, Annual Retail Trade Survey, 2022. Days of inventory are year-end inventories divided by the annual cost of goods sold, times 365.
Clothing, furniture and miscellaneous specialty stores all kept more of each sales dollar than online retailers in 2022, despite carrying about twice as much inventory relative to what they sell. Specialty stores with high gross margins and loyal customers turned out to be at least as profitable as selling online. That does not settle whether starting an online business still makes sense, a question we looked at in is ecommerce worth it in 2026.
Inventory: no lighter online
Another common assumption is that online retailers carry less stock, because they do not need to fill shelves in many locations. The Census data does not support it at an industry level. Online and mail-order retailers ended 2022 with inventory equal to 54 days of cost of goods sold, almost the same as retail overall excluding car dealers (53 days) and general merchandise stores (54 days). Over the decade, online inventory days ranged between 52 and 60.
Online retailers sell faster than specialty stores, but not faster than retail as a whole. Fast delivery promises require stock close to customers, often in several warehouses, which offsets the benefit of having no shelves to fill. Keeping inventory lean is an operational discipline rather than an automatic benefit of selling online; our guide to inventory management best practices covers the basics.
What this means for online stores
The Census figures describe the whole industry, dominated by large companies, but the direction applies to sellers of every size:
- Do not assume your model is cheaper. An online store that plans on lower overheads than a shop is planning on an advantage the industry lost a decade ago. Budget for fulfillment, acquisition and technology as core costs.
- Protect gross margin first. Online retailers stay ahead of stores mainly because they earn more per sale. Discounting erodes the one advantage that still holds.
- Watch operating costs per order, not just in total. Online costs scale with order volume in a way store costs do not. Our ecommerce profit calculator breaks a single order into the costs that decide whether it makes money.
- Treat marketing as an operating cost to manage. Paid acquisition is one of the costs that grow with every order, so it needs the same scrutiny as rent or payroll.
- Cut avoidable returns. Returns add handling costs to the orders that already earn the least, which makes return policy a profit decision rather than a customer service detail.
None of this makes online retail a worse business. Online retailers still kept more of each dollar than comparable stores in 2022, and they reach customers stores cannot. But the gap is now small enough that execution, not the channel, decides who is more profitable.
Limits of the data
- Industry totals, not typical businesses. The figures are aggregates in which the largest companies carry the most weight, so a small online store’s ratios can differ widely.
- Classification by main activity. A store chain’s website sales are counted under its store category, not under online retailers, so the comparison is between business models rather than between channels.
- Mail order is included. The online group includes catalog and other non-store sellers, although online sales make up the large majority of its sales.
- Operating expenses are a total. The published tables do not break operating expenses into individual cost lines, so the sources of the increase are inferred rather than measured.
- The series ends in 2022. As the Census Bureau explains on the survey’s page, its data collection has moved to the Annual Integrated Economic Survey, so later years are not published on the same basis.