Japan has one of the world’s largest consumer markets, near-universal smartphone ownership and some of the most efficient delivery networks anywhere. Yet in 2024, less than one yen in ten that Japanese consumers spent on goods went through ecommerce. Ten years earlier it was less than one in twenty, and the pace of change is now slowing rather than speeding up.
We analyzed the Ministry of Economy, Trade and Industry’s annual E-Commerce Market Survey, the official measure of Japan’s online market, for 2014 to 2024. The latest edition, published in August 2025, is the 27th in a series that began in 1998. The data shows a market that doubled in a decade, a pandemic jump that has largely run its course, and a few categories where most of the remaining opportunity sits.
Key findings
- Japan’s consumer ecommerce market reached ¥26.1 trillion in 2024, up 5.1% on 2023 and more than double the ¥12.8 trillion of 2014.
- Online sales of goods reached ¥15.2 trillion, 9.78% of all consumer goods sales, up from 4.37% in 2014.
- Growth in online goods sales has slowed every year since 2020: 21.7% in 2020, 8.6% in 2021, 5.4% in 2022, 4.8% in 2023 and 3.7% in 2024, the slowest in the decade.
- About ¥140 trillion of consumer goods sales still happen offline, based on the size of the total market implied by METI’s figures.
- Food is the biggest online category by value (¥3.12 trillion) but one of the least digital, at 4.52% of food and drink sales.
- Smartphones carried 61.7% of online goods sales in 2024, and smartphone sales grew 9.0% while sales through other devices fell.
How the data works
METI’s survey estimates the value of business-to-consumer (B2C) ecommerce in three sectors: goods (called the merchandising sector), services such as travel and dining reservations, and digital content such as games and e-books. It also estimates business-to-business ecommerce, consumer-to-consumer resale and cross-border purchases between Japan, the US and China.
The key measure for online retailers is the EC ratio: the share of all sales in a goods category that happen through ecommerce, with the total including sales by phone, fax, email and in person. METI calculates it only for goods, because for services and digital content a meaningful total market is hard to define. All values are in nominal yen, and figures refer to calendar years. The full methodology is in METI’s survey report (in Japanese).
A market that doubled in ten years
Japan’s total B2C ecommerce market grew from ¥12.8 trillion in 2014 to ¥26.1 trillion in 2024, an increase of 104%. The three sectors followed different paths:
| Year | Goods | Services and digital | Total B2C ecommerce |
|---|---|---|---|
| 2014 | ¥6.80 trillion | ¥5.99 trillion | ¥12.80 trillion |
| 2016 | ¥8.00 trillion | ¥7.13 trillion | ¥15.14 trillion |
| 2018 | ¥9.30 trillion | ¥8.69 trillion | ¥17.98 trillion |
| 2019 | ¥10.05 trillion | ¥9.31 trillion | ¥19.36 trillion |
| 2020 | ¥12.23 trillion | ¥7.04 trillion | ¥19.28 trillion |
| 2021 | ¥13.29 trillion | ¥7.41 trillion | ¥20.70 trillion |
| 2022 | ¥14.00 trillion | ¥8.75 trillion | ¥22.74 trillion |
| 2023 | ¥14.68 trillion | ¥10.17 trillion | ¥24.84 trillion |
| 2024 | ¥15.22 trillion | ¥10.90 trillion | ¥26.12 trillion |
METI, E-Commerce Market Survey. Services and digital calculated as total minus goods.
2020 is the only year in the series when the total fell, by 0.4%. Online goods sales jumped 21.7% as people shopped from home, but online travel and service bookings collapsed, cutting the services and digital total from ¥9.31 trillion to ¥7.04 trillion. Services recovered fully by 2023, and in 2024 travel alone accounted for ¥3.52 trillion of online sales, up 10.3%.
The share of goods bought online
For anyone selling physical products, the EC ratio is the number that matters:
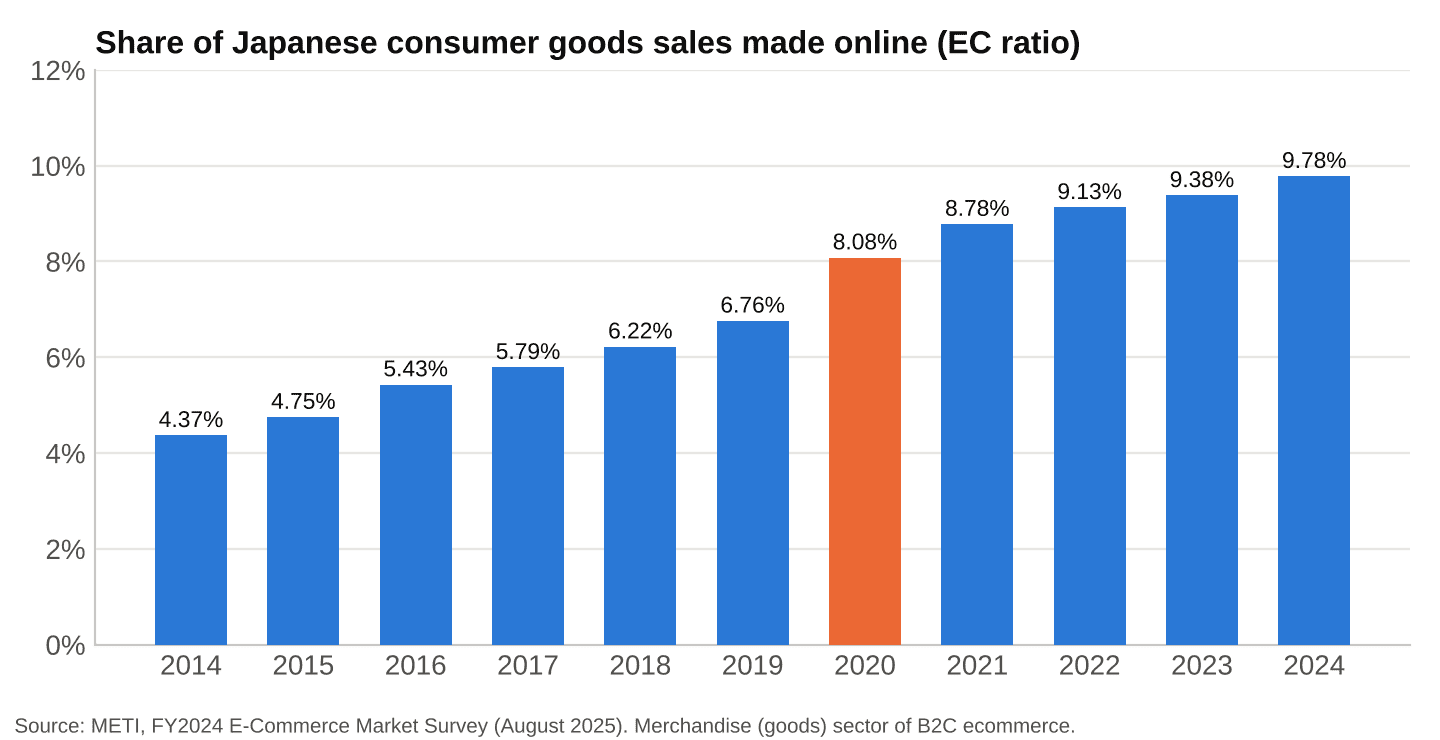
Share of Japanese consumer goods sales made online, 2014 to 2024
The share of goods sales made online more than doubled over the decade, from 4.37% to 9.78%. The growth came in three phases:
- 2014 to 2019: steady gains of about half a percentage point a year, from 4.37% to 6.76%
- 2020: a one-year jump of 1.32 points, to 8.08%, as the pandemic pushed shopping online
- 2021 to 2024: gains of 0.70, 0.35, 0.25 and 0.40 points, an average of about 0.43 a year
The pandemic moved Japan’s online share up by roughly two to three years of normal growth, and since then it has returned to a pace slightly slower than before. That pattern is similar to what happened in other mature markets, which we traced for the UK in our study of 20 years of ONS data, though Japan started from a much lower base.
Growth is slowing
The slowdown is clearer in the growth of online goods sales themselves:
| Year | Online goods sales | Annual growth |
|---|---|---|
| 2019 | ¥10.05 trillion | 8.1% |
| 2020 | ¥12.23 trillion | 21.7% |
| 2021 | ¥13.29 trillion | 8.6% |
| 2022 | ¥14.00 trillion | 5.4% |
| 2023 | ¥14.68 trillion | 4.8% |
| 2024 | ¥15.22 trillion | 3.7% |
Before the pandemic, online goods sales grew between 6.4% and 10.6% a year. Since 2021, growth has fallen every year, and 2024’s 3.7% was the weakest of the decade. With consumer prices rising in Japan over the same period, part of even that growth reflects higher prices rather than more goods sold.
The remaining opportunity is still enormous. Dividing ¥15.22 trillion of online goods sales by the 9.78% EC ratio implies a total consumer goods market of about ¥156 trillion, of which roughly ¥140 trillion was still sold offline in 2024.
Which categories are online, and which are not
The gap between categories is wider than in most markets:
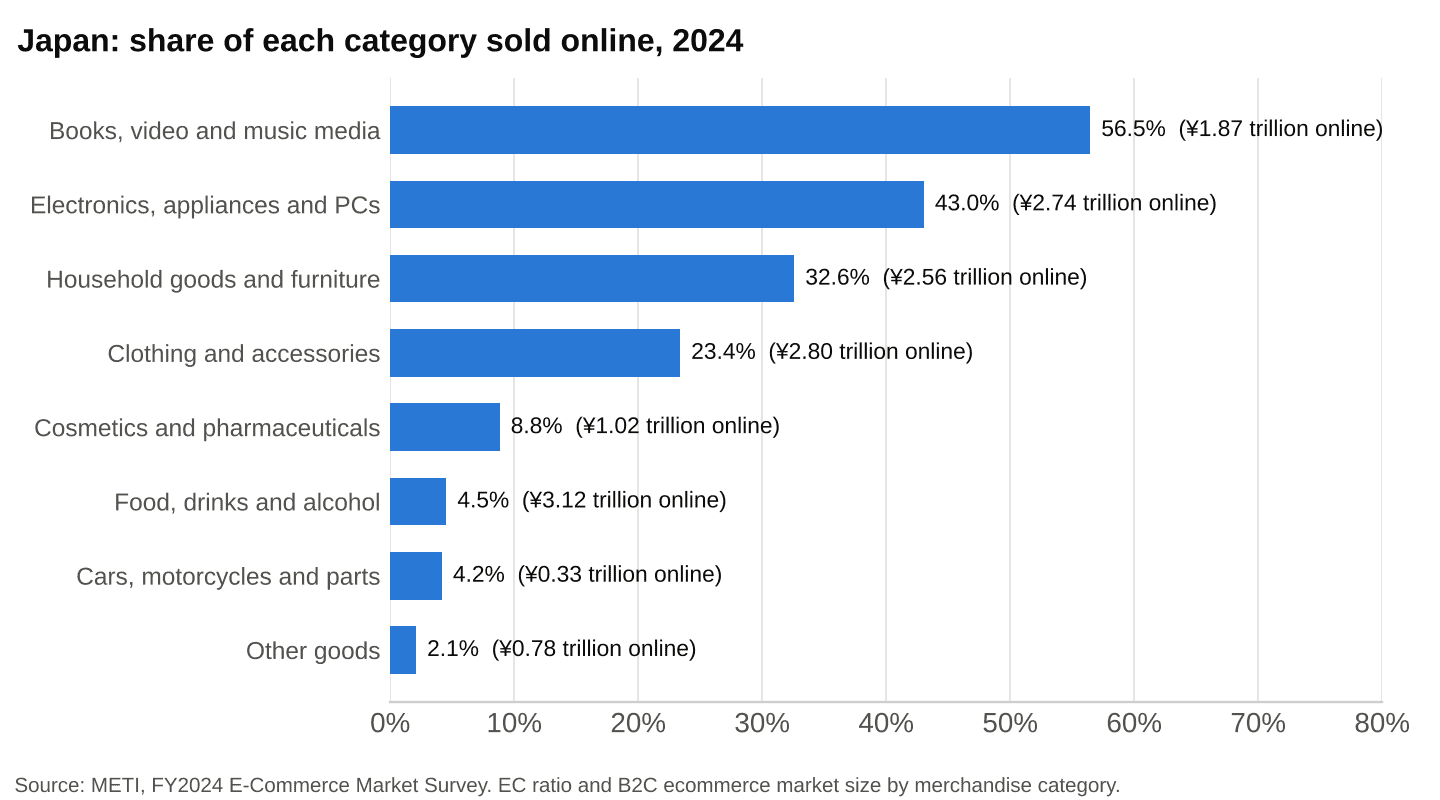
Share of each category sold online in Japan, 2024
| Category | Online sales, 2024 | EC ratio, 2024 | Online growth, 2024 |
|---|---|---|---|
| Food, drinks and alcohol | ¥3.12 trillion | 4.52% | 6.36% |
| Clothing and accessories | ¥2.80 trillion | 23.38% | 4.74% |
| Electronics, appliances, PCs and peripherals | ¥2.74 trillion | 43.03% | 2.26% |
| Household goods, furniture and interiors | ¥2.56 trillion | 32.58% | 3.62% |
| Books, video and music media | ¥1.87 trillion | 56.45% | -0.84% |
| Cosmetics and pharmaceuticals | ¥1.02 trillion | 8.82% | 4.54% |
| Cars, motorcycles and parts | ¥0.33 trillion | 4.16% | 3.50% |
| Other | ¥0.78 trillion | 2.08% | 5.49% |
METI, FY2024 E-Commerce Market Survey.
Three groups emerge:
- Mature categories: books and media (56.45%) and electronics (43.03%) are already largely online, and their growth has slowed to near zero. Books and media actually shrank in 2024.
- Middle categories: household goods and furniture (32.58%) and clothing (23.38%) are well established online but still mostly bought in stores.
- Under-digitized categories: food and drink (4.52%) and cosmetics and pharmaceuticals (8.82%) are where Japanese shoppers still overwhelmingly buy offline.
Food is the most striking. It is already the largest online category by value, and it grew fastest in 2024 at 6.36%. METI’s figures imply a total food and drink market of about ¥69 trillion, so every additional percentage point moved online is worth roughly ¥0.7 trillion of sales. Selling consumables people buy again and again is a strong model for small stores, as we argued in sell what people run out of, not what’s trending, and Japan’s food category shows how much room that model can still have.
Smartphones have taken over
METI estimates that ¥9.39 trillion of online goods sales in 2024 were made through smartphones, 61.7% of the total. Smartphone sales grew by ¥0.77 trillion, or 9.0%, compared with 3.7% for online goods overall. That means sales through PCs and other channels fell, by about 3.8% based on METI’s figures.
The device data in the report explains why: 90.6% of Japanese households owned a smartphone in 2023, while PC ownership had fallen to 65.3%. For stores selling into Japan, a mobile-first checkout is no longer an option but the main storefront, a point that applies to fast mobile payment flows like those covered in our overview of one-click checkout solutions.
Resale and cross-border
Two smaller parts of the survey are worth noting for online sellers:
- Consumer-to-consumer resale was worth ¥2.53 trillion in 2024, but grew only 1.82%, much slower than the resale boom seen in parts of Europe.
- Cross-border purchases are lopsided. Chinese consumers bought ¥2.64 trillion of goods online from Japanese businesses in 2024, up 8.5%, while Japanese consumers bought only ¥441 billion online from US and Chinese businesses combined, up 4.8%.
For Japanese brands, selling abroad is a larger online opportunity than Japan’s domestic market growth. For foreign sellers, Japanese consumers remain largely loyal to domestic stores and marketplaces. The practical requirements of shipping across borders are covered in our guide to international shipping and customs.
Business-to-business is far bigger
As in other large economies, the largest part of Japanese ecommerce is between businesses. METI estimates Japan’s B2B ecommerce market at ¥514.4 trillion in 2024, up 10.6%, with an EC ratio of 43.1%, up 3.1 points in one year. Business-to-business ecommerce in Japan is growing almost three times as fast as consumer goods ecommerce, a gap similar to the pattern we covered for the US in B2B ecommerce is eight times bigger than online retail.
What this means for online sellers
- Japan is a large market with a low ceiling so far. At under 10% online for goods, there is room to grow, but recent growth rates show shoppers are moving slowly.
- Look at food, cosmetics and pharmaceuticals. These are the least digitized categories in value terms, and food is both the largest and the fastest-growing online category.
- Mature categories need a different strategy. In electronics and media, online share is already high and growth is near zero; winning means taking share from other online sellers.
- Build for smartphones first. More than six in ten online goods yen are spent on a phone, and PC-based sales are shrinking.
- Do not count on cross-border demand from Japan. Japanese consumers buy little from foreign online stores, compared with the large flows going the other way.
How Japan fits into the wider Asia-Pacific picture is covered in our overview of ecommerce by region.
Limits of the data
- Estimates, not a census. METI’s figures are modeled from industry data, company reports and surveys, and earlier years can be revised.
- EC ratio covers goods only. Services and digital content have market sizes but no online share.
- Nominal values. Figures are not adjusted for inflation.
- Resale definition. METI notes that its consumer-to-consumer estimate also includes some business sellers on resale platforms.
- Timing. The latest survey covers 2024 and was published in August 2025. The next edition, covering 2025, had not been released at the time of writing.