What Eurostat’s 2025 data shows
Online shopping in Europe is now routine, which makes it easy to assume it mostly works. Eurostat’s latest survey of households says otherwise. In 2025, more than a third of Europeans who had bought something online in the previous three months ran into at least one problem, and the share has risen with every survey since 2021.
We analyzed Eurostat’s data on problems encountered when buying online for the three survey rounds that use the current questions (2021, 2023 and 2025), across all EU countries and age groups. The results are a practical map of where online stores lose customers’ trust: late deliveries, websites that do not work, wrong or damaged items, and, increasingly, problems with costs, complaints and fraud.
Key findings
- 35.4% of recent EU online shoppers had at least one problem in 2025, up from 32.8% in 2021 and 33.1% in 2023.
- Late delivery is still the most common problem by far, reported by 19.9% of recent online buyers.
- Website problems are growing. 11.5% said a website or app was too difficult to use or did not work properly, up from 9.3% in 2021.
- Wrong or damaged deliveries rose to 10.4%, from 8.2% in 2021.
- The fastest-growing problems are about trust. Final costs higher than shown rose from 2.9% to 4.5%, fraud from 2.6% to 3.9%, and difficulty finding guarantee information from 5.7% to 8.2%.
- Problems are most common among 25 to 34-year-olds (39.7%) and least common among 65 to 74-year-olds (29.2%).
- Countries differ enormously: from 63.9% of online shoppers in Malta and 57.9% in the Netherlands to 4.5% in Portugal.
How we analyzed the data
Eurostat’s survey on ICT usage in households asks people across the EU whether they bought goods or services online in the previous three months and, if so, which of a list of problems they ran into. Since 2021, the questions have been asked in the same form every two years, which makes 2021, 2023 and 2025 directly comparable. Eurostat describes the survey and its wider results in its overview of ecommerce statistics for individuals.
All percentages in this study are shares of people who bought online in the three months before the survey, unless stated otherwise. That is the right base for online sellers: it shows how often recent customers had a bad experience, not how common problems are across the whole population. People could report more than one problem, so the problem types add up to more than the total.
One in three recent buyers had a problem
The share of online shoppers reporting at least one problem has gone up in every survey round:
| Survey year | Had at least one problem | Had no problems |
|---|---|---|
| 2021 | 32.8% | 63.9% |
| 2023 | 33.1% | 65.6% |
| 2025 | 35.4% | 63.3% |
EU27, share of people who bought online in the previous three months. Remaining respondents did not answer.
Measured against the whole population aged 16 to 74 rather than only recent buyers, 22.1% of EU residents had a problem with an online purchase in the three months before the 2025 survey. That is more than one adult in five, in a single quarter.
The rise is not dramatic, but its direction is worth noting. Online shopping in Europe has matured, more people buy online and stores have had years to improve. A growing problem rate suggests that the experience is not keeping pace with the volume.
What goes wrong
The problems split into three groups: delivery, the shopping experience itself, and trust.
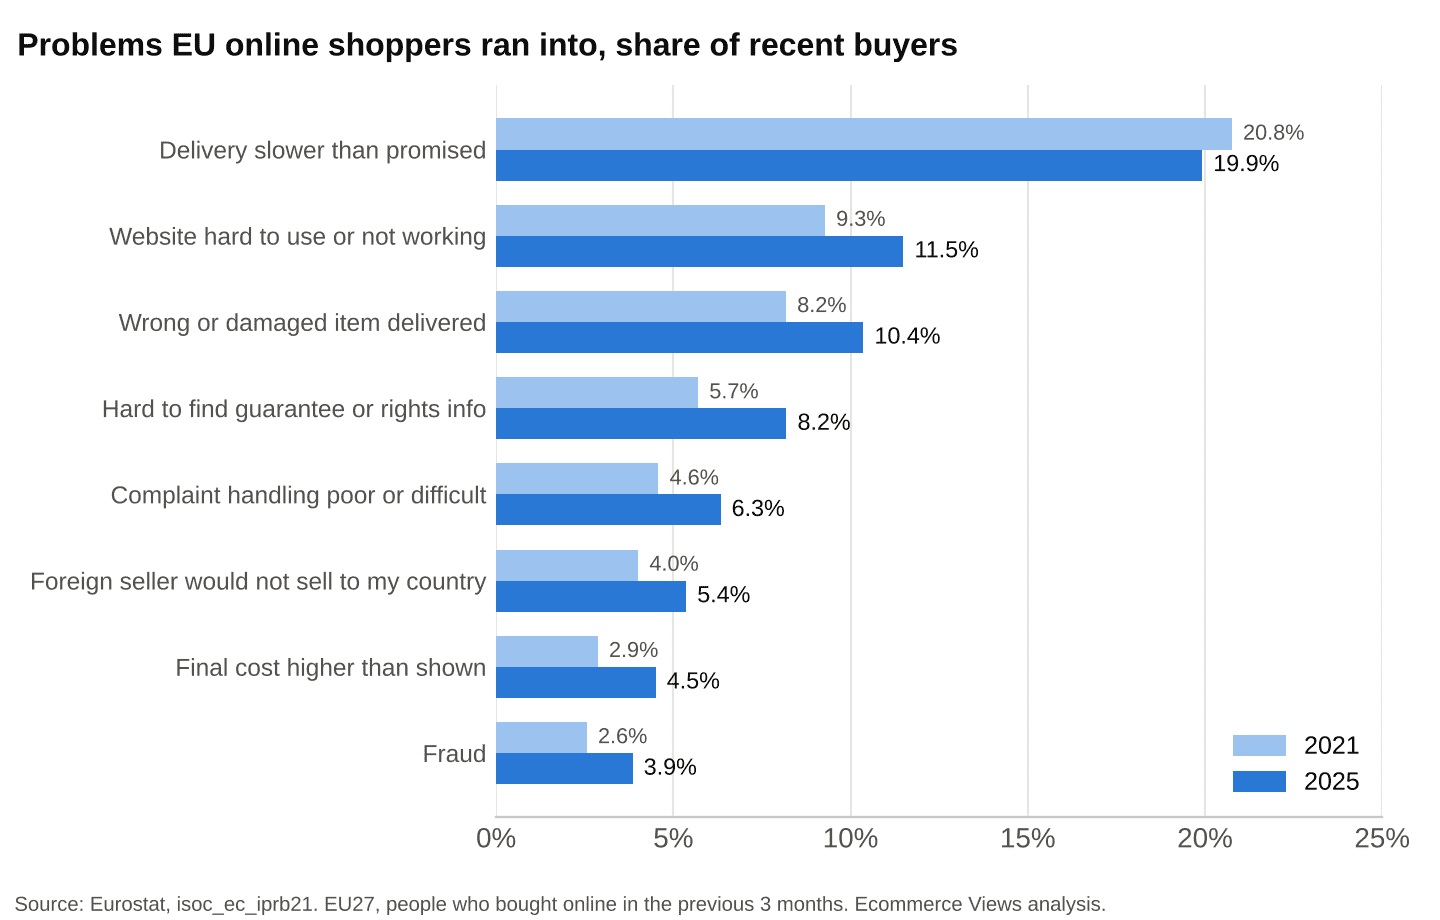
Problems EU online shoppers ran into, 2021 and 2025
| Problem | 2021 | 2023 | 2025 | Change, 2021 to 2025 |
|---|---|---|---|---|
| Delivery slower than indicated | 20.8% | 18.7% | 19.9% | -0.8 points |
| Website or app hard to use or not working | 9.3% | 10.8% | 11.5% | +2.2 points |
| Wrong or damaged item delivered | 8.2% | 8.6% | 10.4% | +2.2 points |
| Hard to find information on guarantees or legal rights | 5.7% | 6.9% | 8.2% | +2.5 points |
| Complaints difficult or no satisfactory response | 4.6% | 4.9% | 6.3% | +1.8 points |
| Foreign seller did not sell to my country | 4.0% | 4.1% | 5.4% | +1.4 points |
| Final costs higher than indicated | 2.9% | 3.4% | 4.5% | +1.6 points |
| Fraud | 2.6% | 3.1% | 3.9% | +1.3 points |
EU27, share of people who bought online in the previous three months.
Every problem except late delivery became more common between 2021 and 2025.
Delivery: still the biggest problem, but no longer growing
One in five recent online shoppers received an order later than promised in 2025. Delivery is the only problem that did not get worse over the period: it fell from 20.8% in 2021, when carriers were struggling with pandemic volumes, to 18.7% in 2023, before edging back up to 19.9%.
For online stores, the lesson is about promises as much as speed. The survey asks whether delivery was slower than indicated, not whether it was slow. A store that promises three to five days and delivers in four does better in this measure than one that promises next day and delivers in two. Realistic delivery estimates, tracking and proactive delay messages are cheap ways to stay out of this statistic, and our guide to last-mile delivery covers the options for getting orders to the door faster.
Websites that do not work
The second most common problem is the store itself. In 2025, 11.5% of recent online buyers said a website or app was too difficult to use or did not work satisfactorily, up from 9.3% in 2021. That makes a poor site experience more common than receiving a wrong or damaged item.
This is the problem most directly in a store’s control, and it is getting worse as sites add features, apps, pop-ups and third-party scripts. Every shopper who reports a broken experience is one who almost certainly abandoned or nearly abandoned a purchase. The fixes, from simpler navigation to faster checkout, are covered in our ecommerce conversion rate optimization guide.
Wrong and damaged deliveries
Receiving the wrong product or a damaged one rose from 8.2% to 10.4% of recent buyers, the largest increase among the physical delivery problems. Unlike late delivery, this one always ends in extra cost: a return, a replacement or a refund, plus customer service time.
The causes are usually inside the business: picking errors, weak packaging and product pages that do not match what arrives. For stores, it is also a returns problem, and returns are expensive enough that the policy around them is a profit decision, as we argued in free returns are a bad default for most online stores.
Trust problems are growing fastest
The smaller problem categories are where the sharpest increases are. In relative terms, between 2021 and 2025:
- Final costs higher than indicated rose by more than half, from 2.9% to 4.5%.
- Fraud rose by about half, from 2.6% to 3.9%.
- Difficulty finding guarantee or legal rights information rose by about 44%, from 5.7% to 8.2%.
- Poor complaint handling rose by about 38%, from 4.6% to 6.3%.
These are the problems that turn a single bad order into a lost customer. Hidden costs at checkout, such as shipping, fees or customs charges added at the last step, feel like a trick even when they are legitimate. The answer is showing the full price as early as possible, which our overview of ecommerce checkout solutions touches on.
Information shoppers cannot find
The rise in shoppers struggling to find guarantee and legal rights information, now 8.2% of recent buyers, deserves its own attention because it is the easiest problem to fix. EU consumers have strong rights on returns, warranties and withdrawal from purchases, yet many store sites bury them in long terms and conditions. A clear page that explains delivery times, returns, warranties and how to complain, in plain language, answers most of these questions before they become complaints. Our guide to creating an effective FAQ page shows how to structure one.
Who has the most problems
Younger online shoppers report more problems than older ones:
| Age group | Any problem | Late delivery | Wrong or damaged item | Website problems | Fraud |
|---|---|---|---|---|---|
| 16 to 24 | 36.6% | 22.1% | 9.2% | 12.2% | 3.9% |
| 25 to 34 | 39.7% | 23.9% | 12.3% | 12.7% | 3.6% |
| 35 to 44 | 36.6% | 21.4% | 11.5% | 11.3% | 3.8% |
| 45 to 54 | 34.9% | 19.1% | 10.4% | 11.2% | 4.3% |
| 55 to 64 | 31.7% | 15.8% | 8.8% | 10.6% | 3.6% |
| 65 to 74 | 29.2% | 13.1% | 7.6% | 10.4% | 4.0% |
EU27, 2025, share of people in each age group who bought online in the previous three months.
The pattern most likely reflects how much and where people buy: younger shoppers order more often, from more stores and from more cross-border marketplaces, so they meet more problems. Two exceptions stand out. Website problems are almost as common among 65 to 74-year-olds (10.4%) as among 16 to 24-year-olds (12.2%), so older shoppers are not more forgiving of a poor site. And fraud is reported at similar rates in every age group, between 3.6% and 4.3%, so it is not a problem only for inexperienced buyers.
Country by country
The share of online shoppers reporting a problem varies more between countries than between any other groups in the data.
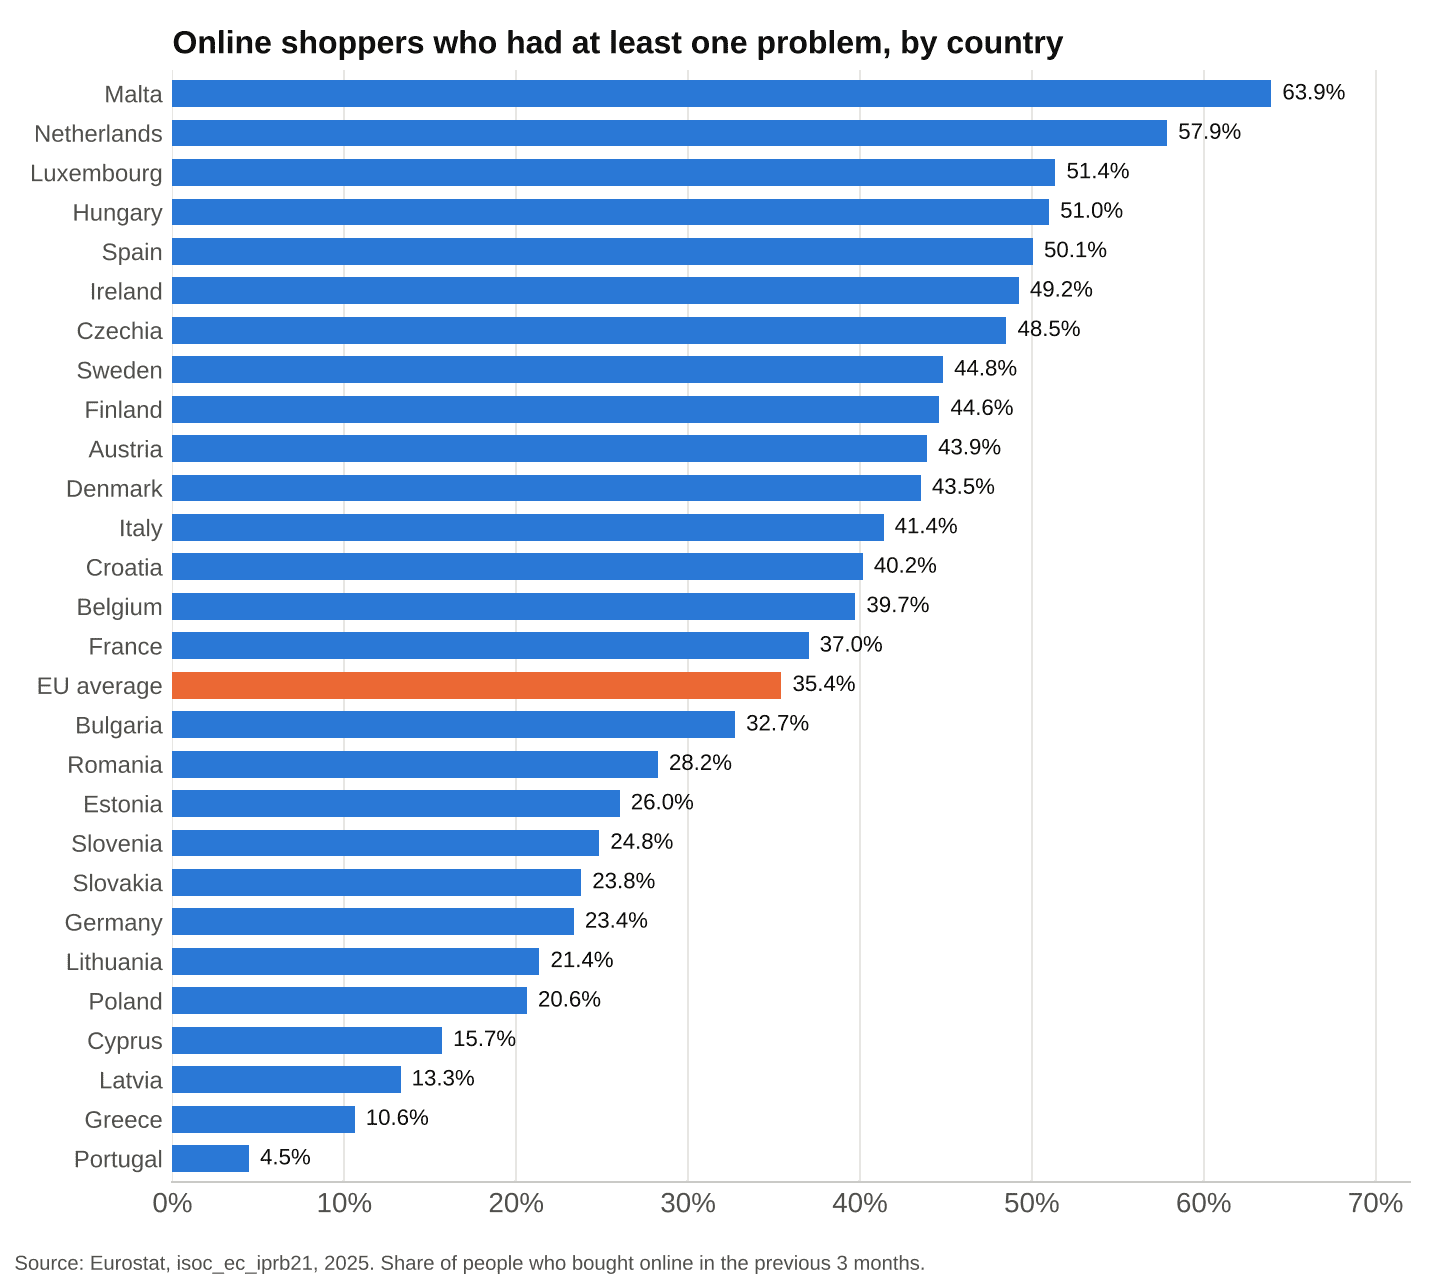
Share of online shoppers who had at least one problem, by EU country, 2025
Malta (63.9%), the Netherlands (57.9%), Luxembourg (51.4%), Hungary (51.0%) and Spain (50.1%) report the highest rates. Portugal (4.5%), Greece (10.6%), Latvia (13.3%), Cyprus (15.7%) and Poland (20.6%) report the lowest, with Germany also well below average at 23.4%.
Some of this gap probably reflects how people answer surveys rather than how often things go wrong, so the ranking should be read with care. The changes within countries are more telling. In Hungary, the share rose from 23.8% in 2021 to 51.0% in 2025, and in Czechia from 27.7% to 48.5%, both far faster than the EU average. Hungary also had the highest fraud rate in the EU in 2025, at 9.1% of recent online buyers, ahead of Spain (7.0%) and Czechia (6.5%).
Shoppers in some countries also run into a problem sellers can fix directly: the foreign store that will not sell to them. 5.4% of recent EU online buyers hit this in 2025, up from 4.0% in 2021. For stores that ship only domestically, each of those is a customer who wanted to buy, and our guide to international shipping and customs covers what it takes to accept them.
What online stores should take from this
The Eurostat data reads like a checklist of where online stores lose customers:
- Promise delivery times you can keep. Late delivery is about missed expectations. Under-promise and track every order.
- Test your site like a stranger. Website problems now affect more shoppers than damaged deliveries. Check checkout on an older phone and a slow connection.
- Check what leaves the warehouse. Wrong and damaged items rose by more than a quarter. Packaging and picking accuracy are cheaper than returns.
- Show the full price early. Surprise costs are the fastest-growing complaint. Display shipping and fees before checkout.
- Make your guarantees easy to find. One shopper in twelve could not find information on their rights. A clear policy page fixes most of this.
- Answer complaints quickly. Poor complaint handling turns a recoverable mistake into a lost customer.
Limits of the data
- The survey measures experiences, not orders. It shows how many people had a problem, not how many orders went wrong.
- Self-reported answers. What counts as a problem depends on expectations, which vary between countries and age groups.
- A three-month window. Problems outside the three months before the survey are not counted, so annual rates would be higher.
- All online purchases. The figures cover goods and services from any seller, including large marketplaces, travel bookings and digital services.
- Every two years. The detailed problem questions are asked in odd years, so the next comparable figures will come from the 2027 survey.