Canada’s online shopping boom during the pandemic was sharp. Then it stopped. Statistics Canada’s annual retail survey shows that online sales by Canadian retailers took 8.7% of retail sales in 2021 and only 8.5% in 2024, three years later.
This study combines 13 years of annual survey data (2012 to 2024) with the monthly retail survey through August 2026. It shows how the share grew, where it stalled, which types of retailers sell most online, and why the first eight months of 2026 look different from the three years before.
Key findings
- Online sales by Canadian-based retailers reached $73.7 billion in 2024, or 8.5% of total retail sales of $865.2 billion.
- The online share rose more than fivefold in nine years, from 1.6% in 2012 to 8.7% in 2021. Most of the jump came in 2020, when the share went from 4.2% to 7.8% in a single year.
- Since 2021 the share has been flat: 7.8% in 2022, 8.1% in 2023 and 8.5% in 2024, under the new industry classification.
- Online sales still grow faster than retail overall. In 2024, ecommerce sales rose 9.0% against 3.0% for all retail.
- Electronics and appliance retailers sell the largest share online (32.5%), followed by shoe stores (24.7%) and clothing stores (24.2%). Grocery retailers sell only 3.6% online.
- New car dealers made $11.5 billion of online sales in 2024, more than clothing stores ($9.0 billion), which makes them the largest single retail industry online in dollar terms.
- 2026 shows a new acceleration. In January to August 2026, monthly ecommerce sales were 7.8% higher than a year earlier, almost double the 4.2% growth of total retail. In 2025, online sales had grown slower than retail overall.
How we analyzed the data
We used three Statistics Canada tables:
- Annual Retail Trade Survey, 2022 to 2024: table 20-10-0084-01, which splits retail sales into in-store, ecommerce, catalogue and other channels for every retail industry.
- Annual Retail Trade Survey, 2012 to 2021: archived table 20-10-0065-01, the predecessor of 20-10-0084.
- Monthly Retail Trade Survey, January 2017 to August 2026: table 20-10-0056-01, which includes a monthly retail ecommerce series.
Unlike the UK, where the ONS publishes online sales by store type every month (see our UK online retail study), Canada’s detailed channel split is annual. Retail ecommerce here means online sales made by Canadian-based retailers. Purchases by Canadians from foreign-based retailers are excluded. Travel, tickets and financial services are also outside retail trade.
Two breaks in the data need care:
- Industry classification, 2021 to 2022. The new annual table uses the 2022 version of the North American Industry Classification System, which dissolved the old “non-store retailers” group and moved online retailers into their product categories. The total retail ecommerce figure stays broadly comparable, but individual industries do not.
- Monthly level break, January 2024. The monthly ecommerce series jumps by 24.8% between December 2023 and January 2024 (seasonally adjusted), while total retail rose 1.2%. When the January 2024 figures were first published, Statistics Canada reported ecommerce sales of $3.8 billion for that month. The current series shows $4.5 billion. The level was revised from January 2024 onward but not before it. We therefore do not compute any monthly growth rate across that break. For 2024 growth we use the annual survey instead.
A decade of slow growth, then one big jump
Between 2012 and 2019, Canadian ecommerce grew steadily but from a low base. Online sales rose from $8.3 billion to $28.3 billion, a growth rate of about 19% a year. The online share of retail moved from 1.6% to 4.2%.
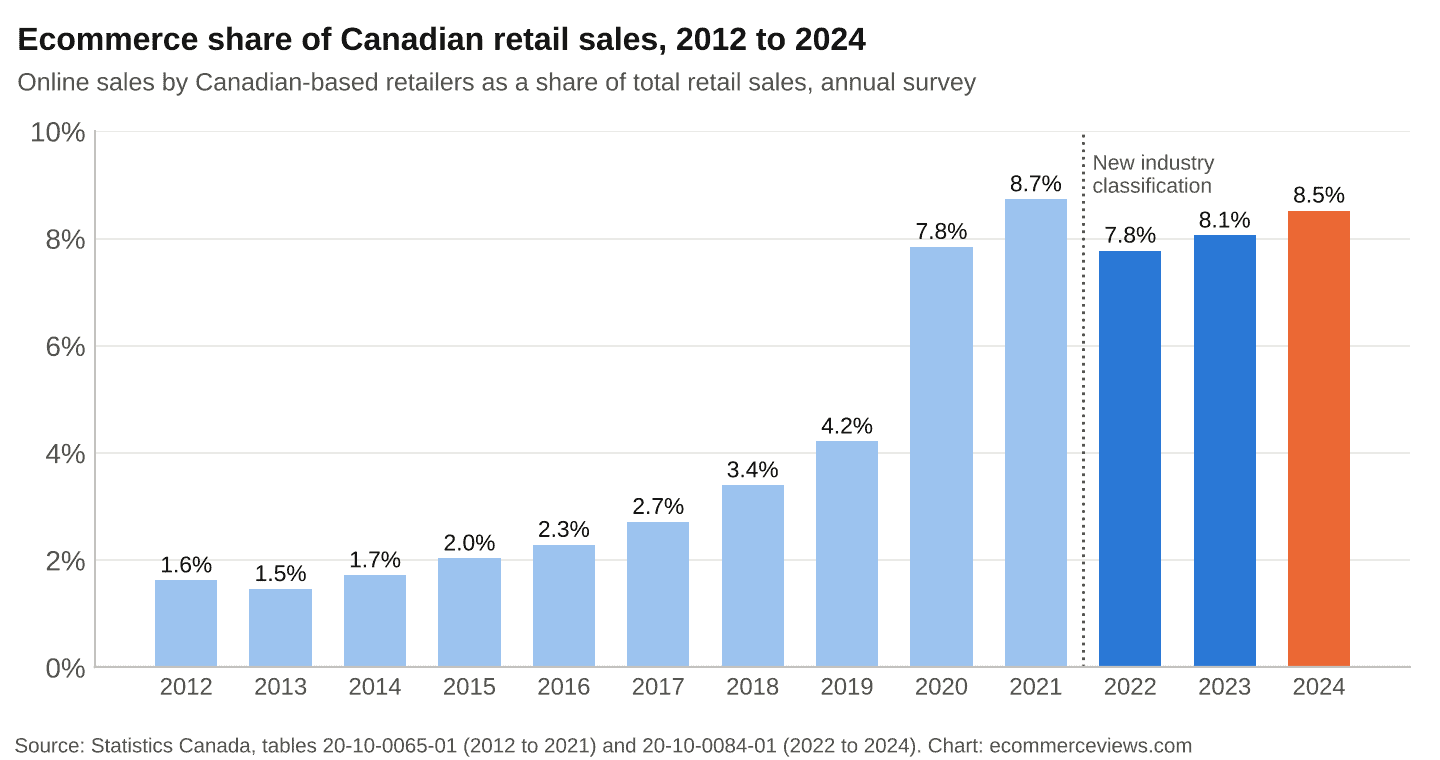
Ecommerce share of Canadian retail sales, 2012 to 2024
Then 2020 compressed years of change into twelve months. With stores closed for long periods, online sales nearly doubled to $52.5 billion and the share jumped to 7.8%. By 2021, online sales were $65.7 billion, 2.3 times their 2019 level, and the share peaked at 8.7%.
| Year | Retail ecommerce sales | Total retail sales | Ecommerce share |
|---|---|---|---|
| 2012 | $8.3 bn | $508.7 bn | 1.6% |
| 2016 | $13.5 bn | $592.3 bn | 2.3% |
| 2019 | $28.3 bn | $670.4 bn | 4.2% |
| 2020 | $52.5 bn | $669.8 bn | 7.8% |
| 2021 | $65.7 bn | $752.2 bn | 8.7% |
| 2022 | $63.2 bn | $813.5 bn | 7.8% |
| 2023 | $67.7 bn | $839.8 bn | 8.1% |
| 2024 | $73.7 bn | $865.2 bn | 8.5% |
Canadian dollars, current prices. 2012 to 2021 from table 20-10-0065-01, 2022 to 2024 from table 20-10-0084-01. Source: Statistics Canada, Annual Retail Trade Survey.
The plateau after 2021
From 2022, online sales grew again, but total retail grew almost as fast. Part of the reason is inflation, which raised spending in categories such as groceries and cars, where most sales still happen in person. The result was a share that moved only 0.7 percentage points in two years.
Online sales grew 7.0% in 2023 and 9.0% in 2024. Total retail grew 3.0% in 2024. So the gap is real, but with online growth of roughly 8% a year, the share gains only about half a percentage point annually. That is a slower path than in the US, where our study of 27 years of Census data shows a steadier upward trend.
The annual survey also shows what the remaining 91.5% of retail looks like. In 2024, in-store sales were $766.8 billion, catalogue, mail and phone sales $8.4 billion, and other methods $16.3 billion. Physical stores still carry close to nine in ten retail dollars.
Which retailers sell most online
The annual survey breaks ecommerce down by type of retailer. In 2024, the gap between industries was enormous.
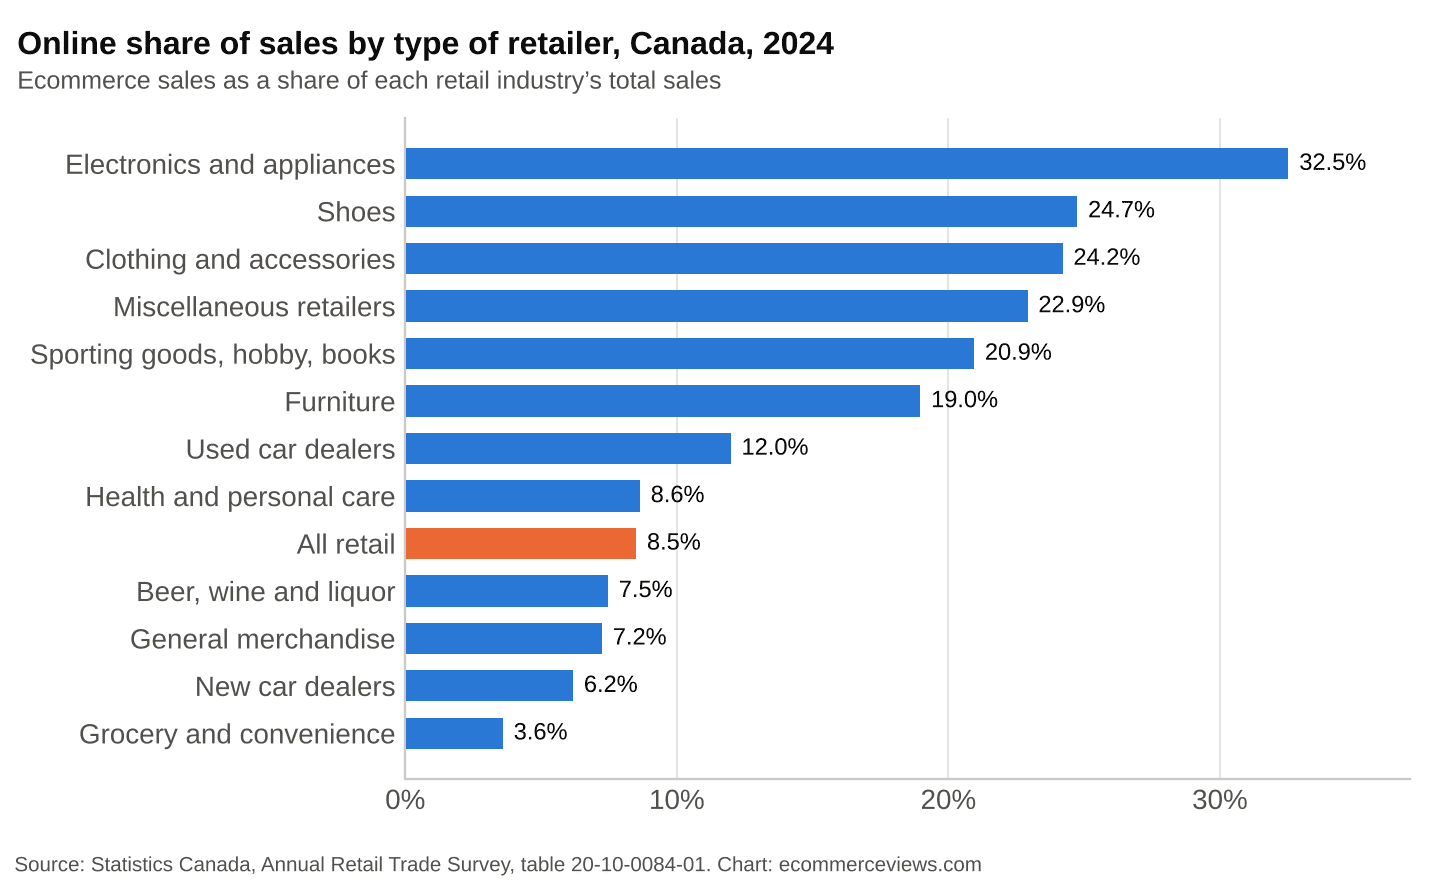
Online share of sales by type of retailer, Canada, 2024
| Type of retailer | Online share 2022 | Online share 2024 | Online sales 2024 |
|---|---|---|---|
| Electronics and appliances | 36.8% | 32.5% | $6.7 bn |
| Shoes | 23.8% | 24.7% | $1.3 bn |
| Clothing and accessories | 21.8% | 24.2% | $9.0 bn |
| Miscellaneous retailers | 17.6% | 22.9% | $7.5 bn |
| Sporting goods, hobby, books | 19.6% | 20.9% | $3.5 bn |
| Furniture | 21.8% | 19.0% | $2.8 bn |
| Used car dealers | 7.6% | 12.0% | $2.7 bn |
| Health and personal care | 9.6% | 8.6% | $7.0 bn |
| General merchandise | 5.8% | 7.2% | $7.8 bn |
| New car dealers | 5.4% | 6.2% | $11.5 bn |
| Grocery and convenience | 2.2% | 3.6% | $4.4 bn |
Source: Statistics Canada, table 20-10-0084-01.
Three findings stand out:
- Durable goods retailers are losing online share. Electronics and appliances fell from 36.8% to 32.5% and furniture from 21.8% to 19.0%. These were the categories that boomed when people furnished home offices in 2020 and 2021, and the shift has partly reversed.
- Fashion keeps gaining. Clothing stores went from 21.8% to 24.2%, and shoe stores sell almost a quarter of their goods online.
- Car dealers are the quiet giant. New car dealers sold $11.5 billion online in 2024, more than any other single retail industry in the table. Their online share is only 6.2%, but their sales are so large that even a small share produces the biggest dollar figure. Used car dealers raised their online share from 7.6% in 2022 to 12.0% in 2024.
Grocery is the opposite case. Grocery and convenience retailers made only 3.6% of sales online in 2024. Because groceries are the largest retail category, even small moves in that share shift the national total.
Holiday shopping is more concentrated online
The monthly survey shows how much more seasonal ecommerce is than retail overall. In 2025, November and December produced 21.5% of the year’s unadjusted ecommerce sales, against 17.5% for total retail. In 2019 the online figure was 23.6%. Online holiday peaks have softened a little since the pandemic, as more everyday purchases moved online, but they remain much sharper than in-store peaks.
That matters for stock planning and cash flow. An online store in Canada should expect more than a fifth of its annual revenue in the last two months of the year, which is why small stores need a clear plan for the season, as we argued in our piece on Black Friday strategy for small stores.
2026: online sales are growing faster again
The monthly series is the only source for 2025 and 2026, and since January 2024 it is internally consistent. It shows two different years.
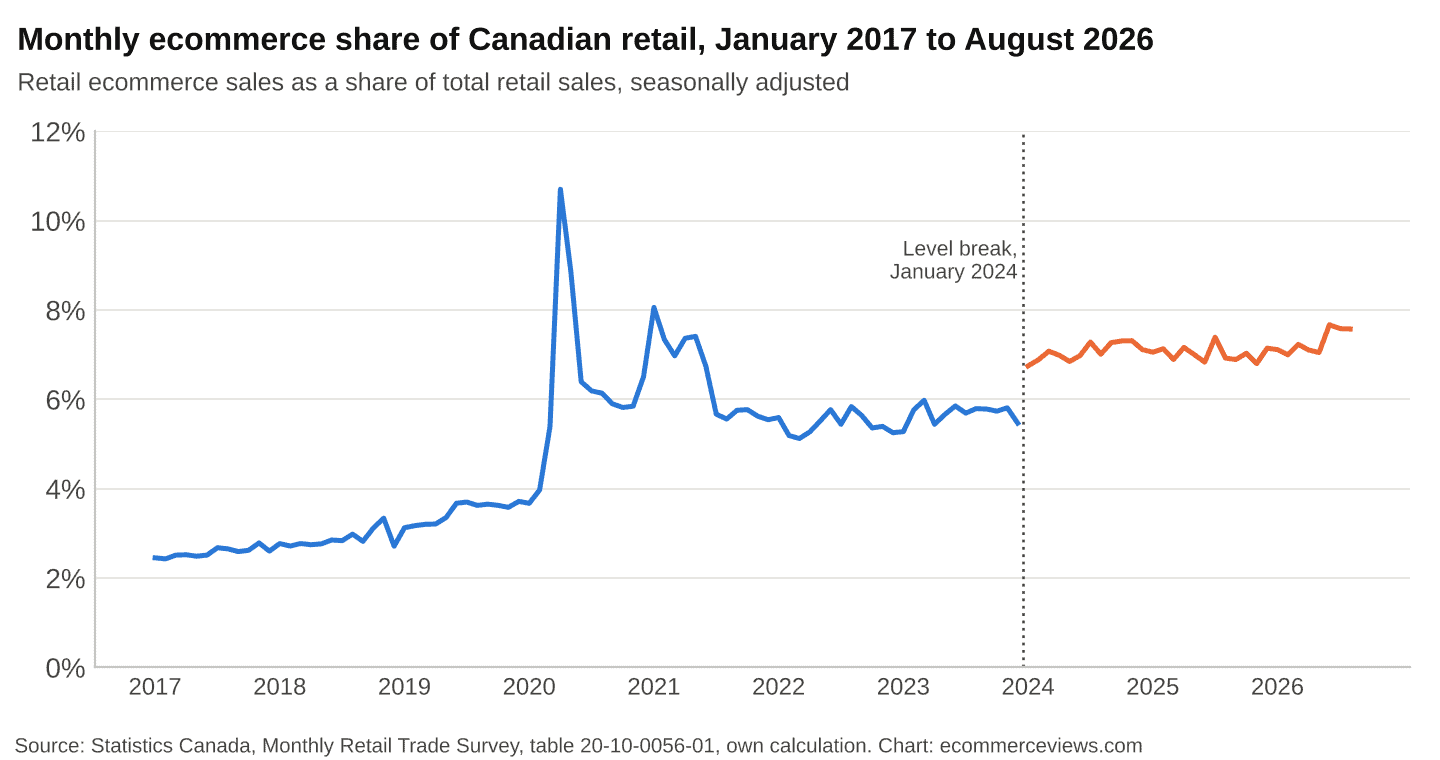
Monthly ecommerce share of Canadian retail, seasonally adjusted, 2017 to 2026
| Period | Ecommerce sales growth | Total retail sales growth |
|---|---|---|
| 2025 vs 2024 (full year) | +2.9% | +3.6% |
| January to August 2026 vs same months of 2025 | +7.8% | +4.2% |
| August 2026 vs August 2025 | +15.5% | n/a |
Unadjusted sales, current dollars. Source: Statistics Canada, table 20-10-0056-01, own calculation.
In 2025, online sales grew more slowly than retail as a whole. That year was dominated by the trade dispute with the United States, which Statistics Canada says affected retailers through price increases, demand changes and supply delays.
In 2026 the trend turned. Seasonally adjusted ecommerce sales rose 9.5% in June 2026 alone and the online share reached 7.7%, the highest monthly level since the series was revised in January 2024. By August, unadjusted online sales were 15.5% above August 2025. A single strong month can be revised, and it is too early to call a new trend. But three months in a row at the new level is the strongest sign since 2021 that Canadian ecommerce is gaining share again.
What this means for online stores
For merchants selling to Canadian customers, the data points to a market that is large, still mostly offline, and uneven across categories.
- Benchmark against your category, not the national average. A clothing store with 10% of sales online is behind its industry. A grocery business with 10% online is well ahead of it. Use the industry table above to judge where you stand.
- Plan for a sharp holiday peak. With over a fifth of online sales in November and December, inventory and fulfillment capacity should be set for the peak, not the average. Our guide on how to increase ecommerce sales covers the conversion basics that matter most in those weeks.
- Do not assume pandemic-era growth rates. Online sales grew about 8% a year from 2022 to 2024. Business plans that assume 20% or more are built on the 2020 to 2021 boom, which was a one-off.
Where the opportunity is in Canada
The categories with low online shares are also where the remaining growth is.
- Watch grocery and health. Grocery moved from 2.2% to 3.6% online in two years, and health and personal care retailers already sell $7.0 billion online. Both categories are large enough that a small shift creates real volume.
- Look at automotive. Car dealers are the biggest online retail industry by dollars, and used car dealers raised their online share by more than half in two years. Parts, accessories and service bookings are a natural fit for online sellers.
- Use the 2026 momentum. If the acceleration holds, the next two years could bring the first meaningful rise in Canada’s online share since 2021. Stores that build capacity now will be better placed. Our look at whether ecommerce is still worth starting in 2026 sets out the broader case.
Limits of the data
- Foreign retailers are excluded. The figures count only online sales by Canadian-based retailers. Canadians’ purchases from foreign websites are not in retail trade statistics, so total online spending by Canadians is higher than these figures show.
- Two surveys, two levels. The annual survey reported $73.7 billion of ecommerce sales in 2024, while the twelve monthly figures for 2024 add up to $57.6 billion. The surveys differ in coverage and method. We use the annual survey for levels and long-run shares and the monthly survey only for recent direction.
- Classification change in 2022. Industry-level figures before and after 2022 are not comparable, and the national total changed definition slightly.
- The January 2024 break is unexplained. We could not find a published note explaining the revision. Monthly growth rates across January 2024 should not be used.
- Nominal dollars. All values are in current Canadian dollars. Part of the growth after 2021 reflects inflation, which affected in-store categories such as food more than online categories.
- 2026 figures are preliminary. The most recent months are often revised in later releases. Statistics Canada’s annual retail trade release for 2024 has more context on the annual figures.
The bottom line
Canada’s online retail share rose from 1.6% to 8.7% in nine years and then stood still for three. The pause was not a collapse: online sales kept growing, just not much faster than the rest of retail. The first eight months of 2026 are the first data in years to show online sales clearly outpacing stores again. For online sellers, Canada remains a market where nine in ten retail dollars are still spent offline, and where the categories with the lowest online shares have the most room to grow.