Eurostat has started publishing the euro value of ecommerce sales by channel, and the new tables answer a question that percentage surveys could not: how much money actually flows through online marketplaces, and how much through businesses’ own websites and apps?
We combined the figures for the 13 EU countries that report a complete series from 2016 to 2024. Together they account for €1.37 trillion of web sales in 2024. The result is clear. Own websites still carry most of the money, but marketplaces have grown much faster, and in a handful of countries they now handle a third or more of all web sales.
Key findings
- Web sales by businesses with 10 or more employees in the 13 countries reached €1,372 billion in 2024, up from €764 billion in 2016. That is growth of about 7.6% a year in nominal terms.
- Marketplaces handled 17.5% of that value in 2024, up from 12.4% in 2016. Own websites and apps handled the remaining 82.5%.
- Marketplace sales grew 2.5 times over eight years (from €94.5 billion to €240.0 billion), while own-site sales grew 1.7 times (from €656 billion to €1,132 billion).
- Outside Germany, the shift is steadier: the marketplace share rose from 9.2% to 15.4% with almost no reversals.
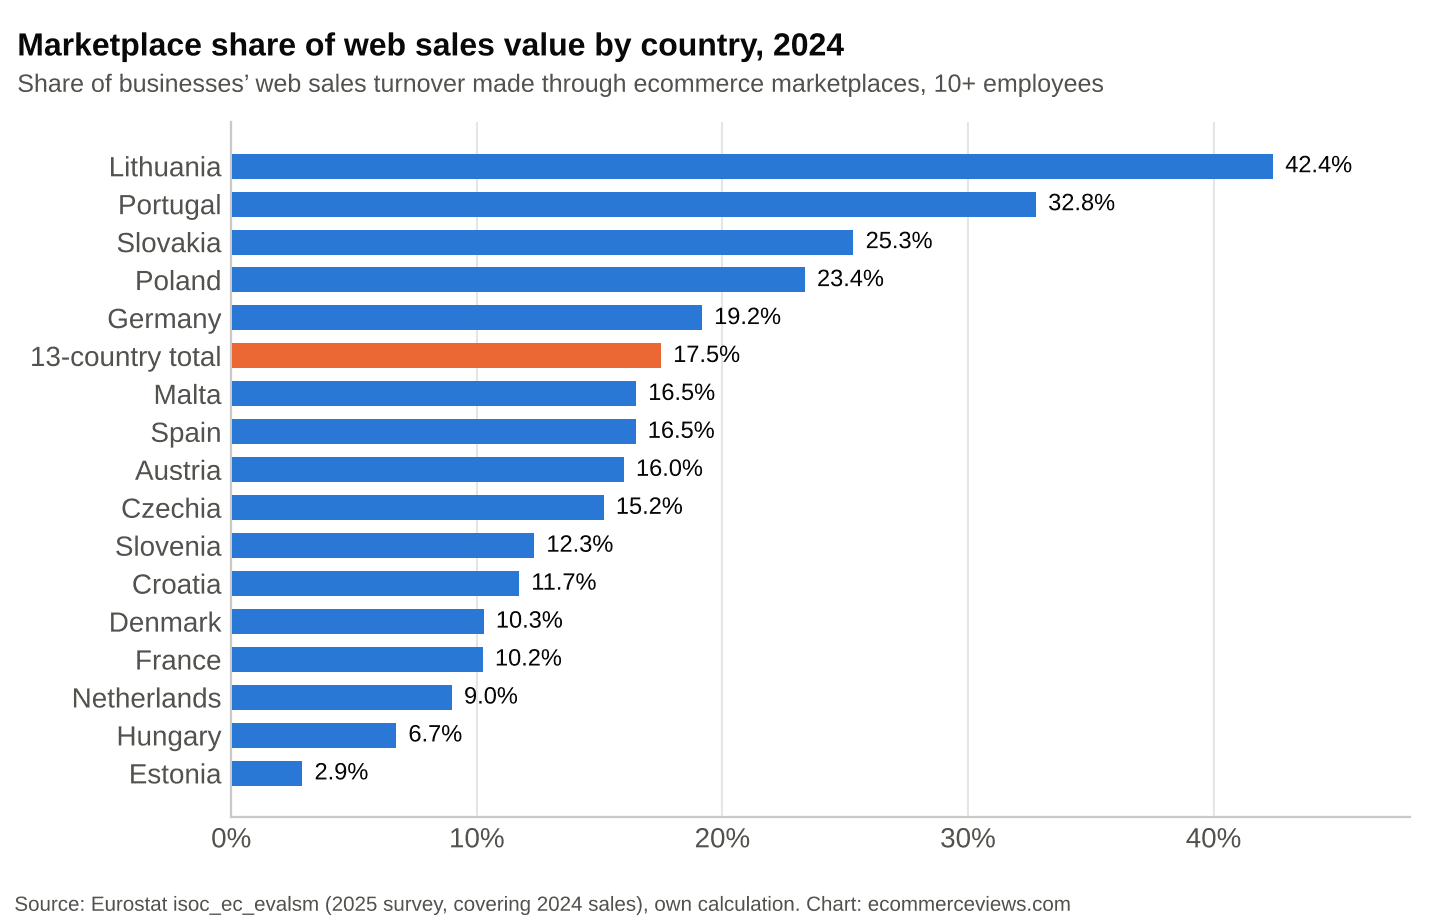
- The country spread is huge. In 2024 marketplaces took 42.4% of web sales value in Lithuania and 32.8% in Portugal, but only 2.9% in Estonia and 6.7% in Hungary.
- Marketplace-only sellers matter more each year. In the 15 countries that report it, businesses that sell only through marketplaces made 23.3% of all marketplace web sales in 2024.
- Consumer sales are taking over: B2C sales rose from 39.4% to 54.2% of web sales value between 2016 and 2024 in the 12 countries with a full series.
How we analyzed the data
The source is Eurostat’s monetary value of ecommerce sales by size class (isoc_ec_evalsm), released in July 2026, together with the companion table by industry (isoc_ec_evaln2m). Both come from the annual survey on ICT usage and e-commerce in enterprises and cover businesses with 10 or more employees, outside agriculture, mining and finance.
Definitions used in this study:
- Web sales are orders received through a website, an app or an ecommerce marketplace. EDI-type sales between business systems are excluded.
- Marketplace sales are web sales made through a marketplace that hosts many businesses, such as Amazon, eBay, Allegro or Booking.com. Own-site sales are made through the business’s own website or app.
- Years: the survey asks about sales in the previous calendar year, so the 2025 survey describes 2024 sales. We label every figure by the sales year.
Eurostat does not publish an EU total in euros, and several large countries (including Italy, Belgium, Ireland and Sweden) do not report values in this table. To get a consistent picture, we built a 13-country panel: Austria, Croatia, Czechia, Denmark, Estonia, France, Germany, Hungary, Lithuania, Malta, Portugal, Slovakia and Spain. Each of them reports total web sales, marketplace sales and own-site sales for every year from 2016 to 2024. All values are in current euros, not adjusted for inflation.
Marketplaces gained five percentage points in eight years
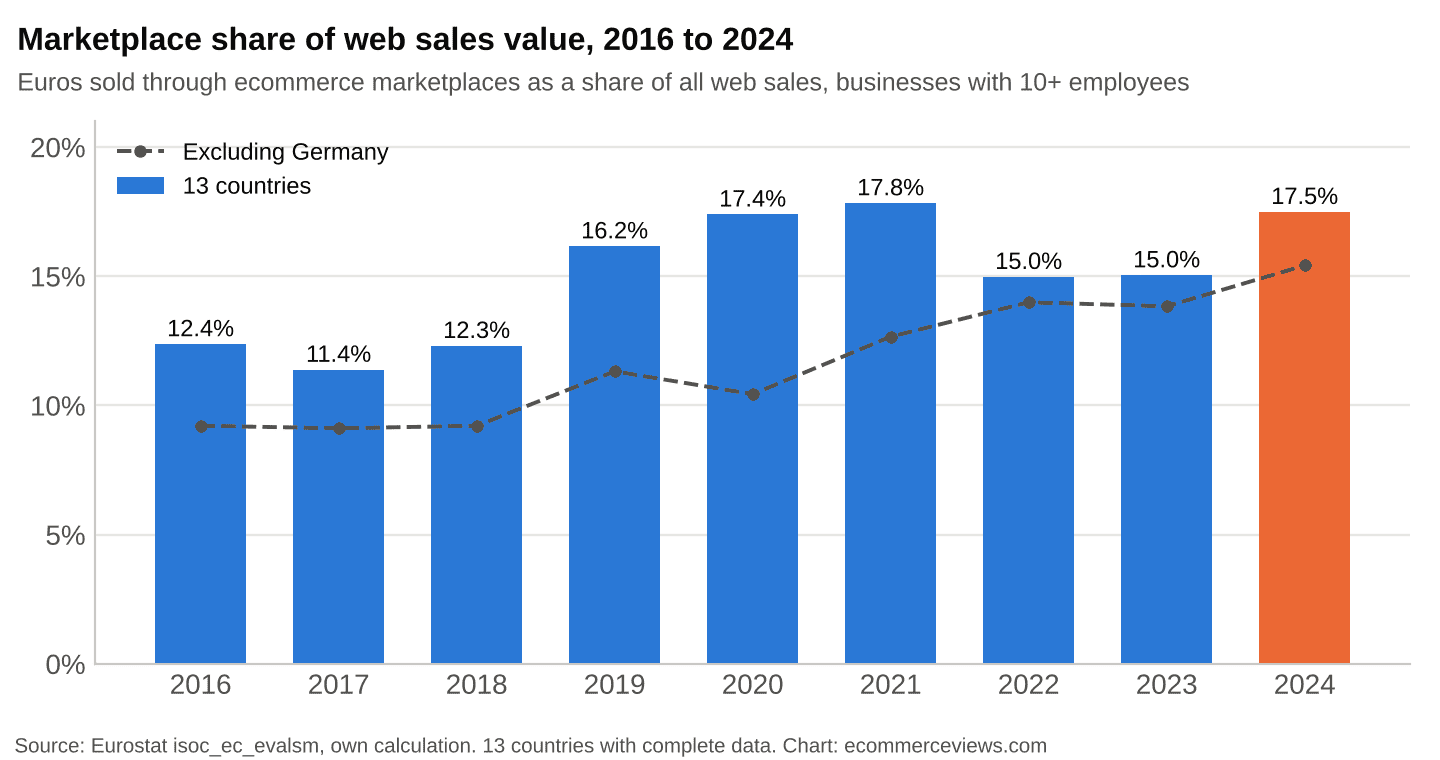
In 2016, 12.4% of the panel’s web sales value went through marketplaces. By 2024 the share was 17.5%, a gain of 5.1 percentage points.
Marketplace share of web sales value in 13 EU countries, 2016 to 2024
The path was not smooth. The share jumped in 2019 and peaked at 17.8% in 2021, then fell back to 15.0% in 2022 and 2023 before rising again. Most of that volatility comes from Germany, which accounts for 55.5% of the panel’s web sales value and reports large swings from year to year.
With Germany removed, the picture is a steady climb: 9.2% in 2016, 10.4% in 2020, 14.0% in 2022 and 15.4% in 2024. That is the better guide to the direction of travel for a typical European market.
| Sales year | Web sales, 13 countries | Through marketplaces | Through own sites | Marketplace share |
|---|---|---|---|---|
| 2016 | €764 bn | €94.5 bn | €656 bn | 12.4% |
| 2018 | €758 bn | €93.3 bn | €662 bn | 12.3% |
| 2020 | €848 bn | €147.5 bn | €700 bn | 17.4% |
| 2022 | €986 bn | €147.7 bn | €838 bn | 15.0% |
| 2024 | €1,372 bn | €240.0 bn | €1,132 bn | 17.5% |
Businesses with 10 or more employees. For some countries and years, marketplace and own-site sales add up to slightly less than total web sales. Source: Eurostat isoc_ec_evalsm, own calculation.
Own websites still carry most of the money
The headline number cuts both ways. Marketplaces are growing, but 82.5% of web sales value in the panel still went through businesses’ own websites and apps in 2024. In euro terms, own sites brought in €1,132 billion, almost five times the marketplace total.
That matters because many discussions of European ecommerce treat marketplaces as the default route to online customers. For established businesses with 10 or more staff, they are not. Most of them sell through their own store, built on one of the platforms we compare in our ecommerce platform overview. Most of the money comes from customers who buy directly, often repeat customers, B2B accounts and buyers who arrive through search, email or a brand they already know.
Index of web sales value by channel, own websites vs marketplaces, 2016 = 100
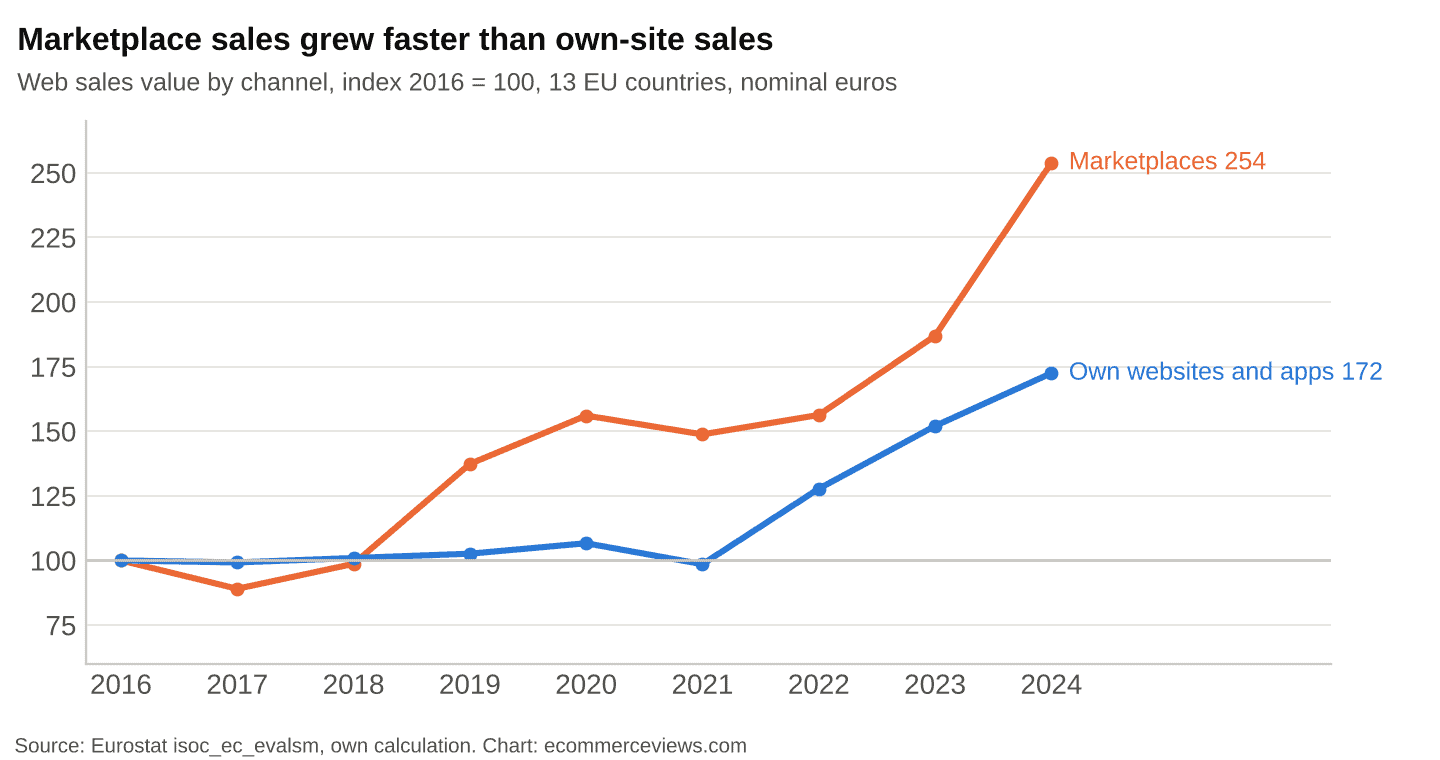
The growth rates tell a different story from the levels. Between 2016 and 2024, marketplace web sales rose by 154% and own-site sales by 72%. Marketplace sales grew about 12.4% a year on average, own-site sales about 7.1% a year. Own-site sales were flat from 2016 to 2021 and only started to climb after 2021, while marketplace sales took off from 2019.
The country gap is wider than any trend
A single panel average hides very different national markets. In 2024, the marketplace share of web sales value ranged from 2.9% to 42.4%.
Marketplace share of web sales value by country, 2024
Three patterns stand out:
- Smaller Central and Eastern European markets lean on marketplaces. Lithuania (42.4%), Slovakia (25.3%) and Poland (23.4%) all sit well above the panel total. In Poland, the share reflects the weight of Allegro, the country’s dominant marketplace.
- Portugal is the outlier in the West at 32.8%. Its marketplace sales rose from €1.6 billion in 2016 to €10.4 billion in 2024.
- Large Western markets with strong direct brands lean the other way. France (10.2%) and the Netherlands (9.0%) both run well below the panel total, as do Denmark (10.3%) and Estonia (2.9%).
Germany sits in between at 19.2%. Because Germany is so large, its 2024 marketplace sales alone (€146.0 billion) were bigger than the total web sales of every other country in the chart except Spain, France and the Netherlands.
These differences match what we see in consumer behavior. Our analysis of what Europeans buy online found that buying habits vary as much between member states as between age groups. The seller side of the market shows the same split.
The rise of marketplace-only businesses
From the 2024 survey onward, Eurostat also asks how much of the marketplace turnover comes from businesses that sell only through marketplaces, with no web shop of their own.
| Country | Marketplace share of web sales, 2024 | Marketplace-only sellers’ share of marketplace sales, 2024 |
|---|---|---|
| Slovakia | 25.3% | 85.4% |
| Lithuania | 42.4% | 74.4% |
| Slovenia | 12.3% | 62.8% |
| Austria | 16.0% | 28.5% |
| Hungary | 6.7% | 24.1% |
| Netherlands | 9.0% | 21.0% |
| France | 10.2% | 19.1% |
| Czechia | 15.2% | 18.8% |
| Croatia | 11.7% | 18.2% |
| Spain | 16.5% | 11.3% |
| Portugal | 32.8% | 6.4% |
| Denmark | 10.3% | 6.0% |
Businesses with 10 or more employees. Source: Eurostat isoc_ec_evalsm, own calculation.
Across the 15 countries that report it for 2024, marketplace-only sellers made 23.3% of all marketplace web sales. For 2023, across 14 countries, the figure was 17.4%. The two country groups are not identical (France and the Netherlands joined, Germany dropped out), so the change is indicative rather than exact.
The national figures are the more striking part. In Slovakia, 85.4% of marketplace sales value comes from firms that have no other web channel. In Portugal, which has one of the highest marketplace shares, only 6.4% does. Portuguese businesses use marketplaces as an extra channel next to their own stores. Slovak businesses that sell on marketplaces mostly sell nowhere else online.
That difference matters for risk. A business with its own store can shift volume when marketplace fees or rules change. A marketplace-only business cannot, which is why marketplace management for these firms is about spreading risk across several platforms.
Where marketplaces dominate by industry
The industry table (isoc_ec_evaln2m) has gaps for the largest countries, so it cannot be summed into a reliable total. But it does show one clear result: accommodation is the sector where marketplaces are closest to taking half the money.
| Sector, 2024 | Countries with data | Marketplace share of web sales value |
|---|---|---|
| Accommodation | 9 | 46.6% |
| Motor vehicle trade and repair | 7 | 15.2% |
| Wholesale trade | 9 | 11.7% |
| Manufacturing | 10 | 6.8% |
| Retail trade | 10 | 6.7% |
Businesses with 10 or more employees, sum of reporting countries. Germany and Portugal are not included in any row. Source: Eurostat isoc_ec_evaln2m, own calculation.
Hotels and other accommodation businesses made 46.6% of their web sales value through booking platforms in the reporting countries. The figure has barely moved since 2016 (46.4%). Booking platforms reached that level early and have held it.
Retail looks low at 6.7%, but this is a sum over countries that excludes Germany and Portugal, two of the most marketplace-heavy markets in the panel. The retail figure should be read as a lower bound, not as the EU average.
What this means for online stores
The data supports a balanced view of marketplaces: they are a growing share of the market, but not the main channel for most established sellers.
- Treat marketplaces as a channel, not the business. Own-site sales are still nearly five times larger in euro terms. The businesses with the most stable revenue mix use marketplaces to reach new customers and their own store to keep them.
- Check your country’s marketplace weight before you plan. Selling into Poland, Lithuania or Portugal without a marketplace presence means ignoring a quarter to two fifths of the online market. Selling into France or the Netherlands, a strong own store matters more. Our comparison of Amazon and Temu for sellers covers the trade-offs of the large platforms.
- Avoid becoming a marketplace-only business by accident. In some countries, most marketplace revenue comes from firms with no other web channel. Even a simple direct store with your best sellers gives you a fallback when fees or ranking rules change.
Build the direct channel while marketplaces grow
Marketplace sales grew at roughly 12% a year over the period. If that continues, marketplaces will keep gaining share for years, so the case for a direct channel gets stronger, not weaker.
- Use marketplace customers to build your own list. Packaging inserts, warranty registration and post-purchase emails (where marketplace rules allow) can move repeat buyers to your store.
- Compare the real margin per channel. Marketplace fees, advertising and fulfillment charges often make marketplace orders less profitable than the gross revenue suggests. Track contribution margin, not sales, by channel.
- Watch the B2C shift. B2C sales rose from 39.4% to 54.2% of web sales value in our panel. If your business is mainly B2B, expect more of your buyers to behave like consumers and compare you on marketplaces. Our study on the size of B2B ecommerce explains why that buyer group is still large.
Limits of the data
- Not an EU total. The panel covers 13 of 27 member states. Italy, Belgium, Ireland and Sweden do not report values in this table, and countries with gaps in the series, such as Poland and the Netherlands, are left out of the panel even though they appear in the 2024 country comparison.
- Germany drives the totals. At 55.5% of panel web sales value, Germany’s year-to-year swings move the combined figures. Its reported web sales jumped by 38% in 2024 alone, which may partly reflect sampling or method changes.
- Nominal euros. The values are not adjusted for inflation, which was high in 2022 and 2023. Part of the growth after 2021 is price increases.
- Firms with fewer than 10 employees are excluded. Small online shops, which may rely on marketplaces more, are not in these figures.
- Channel totals do not always add up. In early years, marketplace plus own-site sales came to slightly less than total web sales in some countries, by up to 1.7% of the panel total.
- Values are estimates. National offices often base turnover on preliminary figures, and Eurostat’s methodology notes say the published monetary values should be considered estimates. Its ecommerce statistics overview gives wider context on the survey.
The bottom line
The new euro figures settle a long-running question. Marketplaces are not taking over European ecommerce, but they are taking a steadily larger share of it: more than one in six euros of web sales in our 13-country panel, and up to two in five in some markets. For most established online sellers, the winning setup is still a strong own store with marketplaces as a second engine, not the other way round.
Choosing where to sell? Compare Amazon, eBay, Etsy and Vinted fees side by side in our guide to online marketplaces for UK sellers.