Most talk about UK ecommerce is about shoppers. The official business surveys tell the story from the other side of the till, and it is a surprising one. In 2021, only 11.3% of UK businesses made any sales through a website, an app or an online marketplace, almost exactly the same share as in 2014.
Yet the money flowing through those channels has grown fast. UK businesses sold £459.2 billion through websites and apps in 2021, and the share of business turnover that comes from online sales rose from 7.7% in 2019 to 9.7% in 2023. Online selling is not spreading to more firms. It is concentrating in the firms that already do it, and above all in the largest ones.
This study pulls together three Office for National Statistics (ONS) sources covering 2009 to 2023 to show how much UK businesses sell online, which ones do it, and what that means for smaller sellers.
Key findings
- Website sales by UK businesses with 10 or more employees tripled in ten years, from £110.6 billion in 2009 to £334.9 billion in 2019, an average growth rate of 11.7% a year.
- Website sales overtook EDI in 2018. Sales through electronic data interchange (EDI) rose only 26% over the same decade, so websites went from 29% of business ecommerce sales in 2009 to 50% in 2019.
- Only 11.3% of all UK businesses made website sales in 2021, compared with 10.7% in 2014. Among firms with 1,000 or more employees the share was 40.8%; among firms with fewer than 10 employees it was 10.4%.
- The largest firms take most of the money. Businesses with 1,000 or more employees made £272.8 billion of website sales in 2021, 59.4% of the total, and 80% of all website sales to customers outside the UK.
- Own websites dominate. 93.5% of UK business website sales in 2021 went through the business’s own website or app, 6.0% through online marketplaces and 0.5% through its own social media.
- Online sales now make up 9.7% of business turnover, up from 7.7% in 2019. In distribution, hospitality, transport and communication the share reached 20.0% in 2023.
- Retail is the most online sector by participation: 34.5% of UK retailers made website sales in 2021, against 0.1% of construction firms.
How we analyzed the data
We used three ONS releases:
- E-commerce and ICT activity, UK: 2019, the last edition of the long-running E-commerce Survey. It covers sales values and the share of businesses selling online from 2009 to 2019, split into website sales and EDI sales.
- Digital Economy Survey 2021, which replaced the E-commerce Survey. It reports website sales for 2021 by business size, industry, customer location and type of platform.
- Business turnover from online sales, 2019 to 2023, an ad hoc release from the Management and Expectations Survey published in February 2026. It gives the share of business turnover that comes from online sales, weighted by turnover.
Three definitions matter:
- Website sales are orders received through a website or app. From 2021, the ONS adds sales through the business’s own social media and through online marketplaces.
- EDI sales are orders placed automatically between business computer systems, a mostly business-to-business channel.
- Coverage: all three surveys cover the UK non-financial business economy. The E-commerce Survey included businesses with fewer than 10 employees from 2014, so for long-run trends we use firms with 10 or more employees.
The surveys are not fully comparable with each other. The ONS warns that the 2021 values were collected in a different way, so the jump from 2019 to 2021 should be read with care. We flag these breaks wherever they matter.
A decade in which websites caught up with EDI
For most of the 2010s, the bigger part of UK business ecommerce was not websites at all. It was EDI, the system that lets a supermarket’s stock system send purchase orders straight to a supplier’s system, with no person browsing a page.
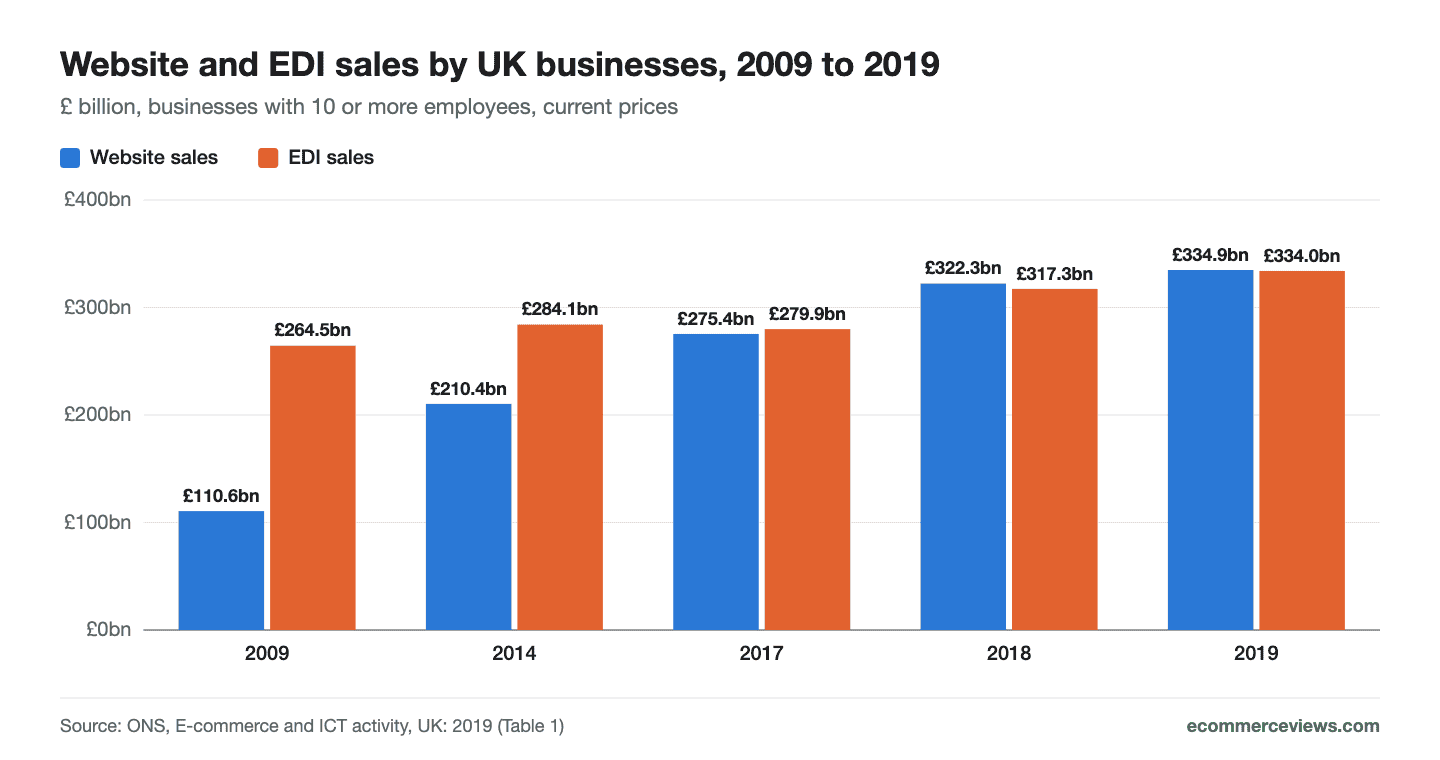
Website and EDI sales by UK businesses, 2009 to 2019
That changed over the decade. Among businesses with 10 or more employees, website sales grew from £110.6 billion in 2009 to £334.9 billion in 2019, more than three times as large. EDI sales grew from £264.5 billion to £334.0 billion, a rise of 26%. Website sales passed EDI for the first time in 2018, at £322.3 billion against £317.3 billion.
| Year | Website sales | EDI sales | Total ecommerce sales | Website share |
|---|---|---|---|---|
| 2009 | £110.6bn | £264.5bn | £375.1bn | 29.5% |
| 2014 | £210.4bn | £284.1bn | £494.5bn | 42.5% |
| 2017 | £275.4bn | £279.9bn | £555.2bn | 49.6% |
| 2018 | £322.3bn | £317.3bn | £639.7bn | 50.4% |
| 2019 | £334.9bn | £334.0bn | £668.9bn | 50.1% |
UK non-financial businesses with 10 or more employees, current prices. Source: ONS, E-commerce and ICT activity, UK: 2019 (Table 1).
The EDI figures also show how large business-to-business ecommerce is, a point we explored in our look at why B2B ecommerce is eight times bigger than online retail. In the UK, most of that EDI trade sits with manufacturers and wholesalers.
Sales grew, but the number of sellers did not
The striking part of the data is how little the share of businesses selling online moved. The ONS figures for all UK businesses, including the smallest, show:
| Year | Share of UK businesses making website sales |
|---|---|
| 2014 | 10.7% |
| 2016 | 9.0% |
| 2018 | 12.9% |
| 2019 | 10.7% |
| 2021 | 11.3% |
All UK non-financial businesses. 2018 was affected by a change from paper to online forms. Source: ONS E-commerce Survey and Digital Economy Survey 2021.
The Digital Economy Survey 2021 bulletin puts total website sales at £459.2 billion in 2021, up 28.8% on 2019. But the share of businesses doing the selling barely changed: roughly one firm in nine, as it was before the pandemic. The growth came from businesses that already sold online selling more, not from new businesses starting.
The same pattern across Europe
This matches what we found across Europe, where only one in four EU businesses sells online. The UK figures cover all businesses including micro firms, which pulls the average down, but the pattern is the same: most companies still do not take orders online at all.
Size decides who sells online
Business size is the strongest predictor of selling online. In 2021, the share of businesses making website sales rose steadily with size.
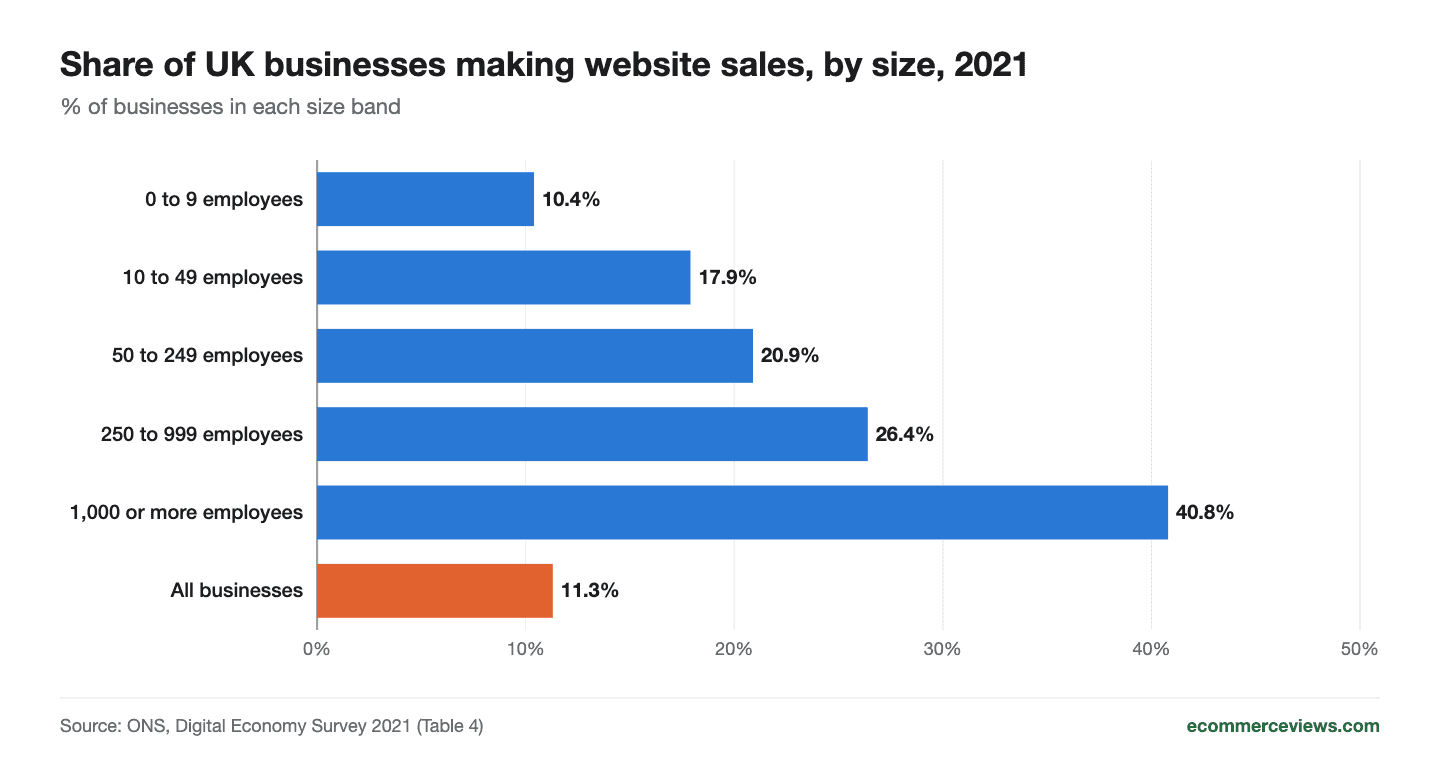
Share of UK businesses making website sales by business size, 2021
The value of those sales is even more concentrated.
| Business size | Share making website sales | Website sales | Share of all website sales | Share of own sales to non-UK customers |
|---|---|---|---|---|
| 0 to 9 employees | 10.4% | £53.3bn | 11.6% | 7.7% |
| 10 to 49 employees | 17.9% | £32.3bn | 7.0% | 12.7% |
| 50 to 249 employees | 20.9% | £19.4bn | 4.2% | 6.2% |
| 250 to 999 employees | 26.4% | £81.4bn | 17.7% | 7.5% |
| 1,000 or more employees | 40.8% | £272.8bn | 59.4% | 22.8% |
| All businesses | 11.3% | £459.2bn | 100% | 16.9% |
UK, 2021. Source: ONS, Digital Economy Survey 2021 (Table 4); shares calculated by ecommerceviews.com.
Firms with 1,000 or more employees made 59.4% of all UK website sales and 80% of website sales to customers outside the UK. Small businesses with 10 to 249 employees, the classic small and medium-sized online store, made only 11.2% of the total between them.
The smallest firms are the exception in one respect: businesses with fewer than 10 employees made £53.3 billion of website sales, more than the 10 to 249 bracket combined. A large number of very small sellers, many of them on marketplaces, adds up.
Own websites, not marketplaces, carry the value
The 2021 survey was the first to split website sales by platform. It shows that marketplaces matter far less to UK business revenue than their visibility suggests.
| Platform | Sales to UK customers | Sales to non-UK customers | Share of total |
|---|---|---|---|
| Own website or app | £353.8bn | £75.4bn | 93.5% |
| Online marketplace | £25.3bn | £2.4bn | 6.0% |
| Own social media | £2.2bn | close to zero | 0.5% |
UK, 2021. Source: ONS, Digital Economy Survey 2021 (Table 6); shares calculated by ecommerceviews.com.
Only 6.0% of the value went through marketplaces and 0.5% through social media shops. These shares are dominated by large firms, which sell mainly through their own sites, so a small store’s mix can be very different. Still, the national picture is clear: the bulk of UK online revenue flows through channels businesses own.
The same survey asked marketplace sellers about problems. Fees and commission charged by the platform were the most commonly reported difficulty, mentioned by more businesses than any other issue, including changes to listings and payment processing. That fits the trend we described in our piece on rising marketplace take rates.
Check your own channel margins
National averages hide very different margins from one store to the next. To see what fees do to your own margin on each channel, try the UK Seller Profit Calculator.
Online sales keep taking a bigger share of turnover
Because the E-commerce Survey stopped after 2019 and the Digital Economy Survey has not been repeated, the best recent measure comes from the ONS Management and Expectations Survey. Its February 2026 release estimates the share of turnover that UK businesses with 10 or more employees make from online sales.
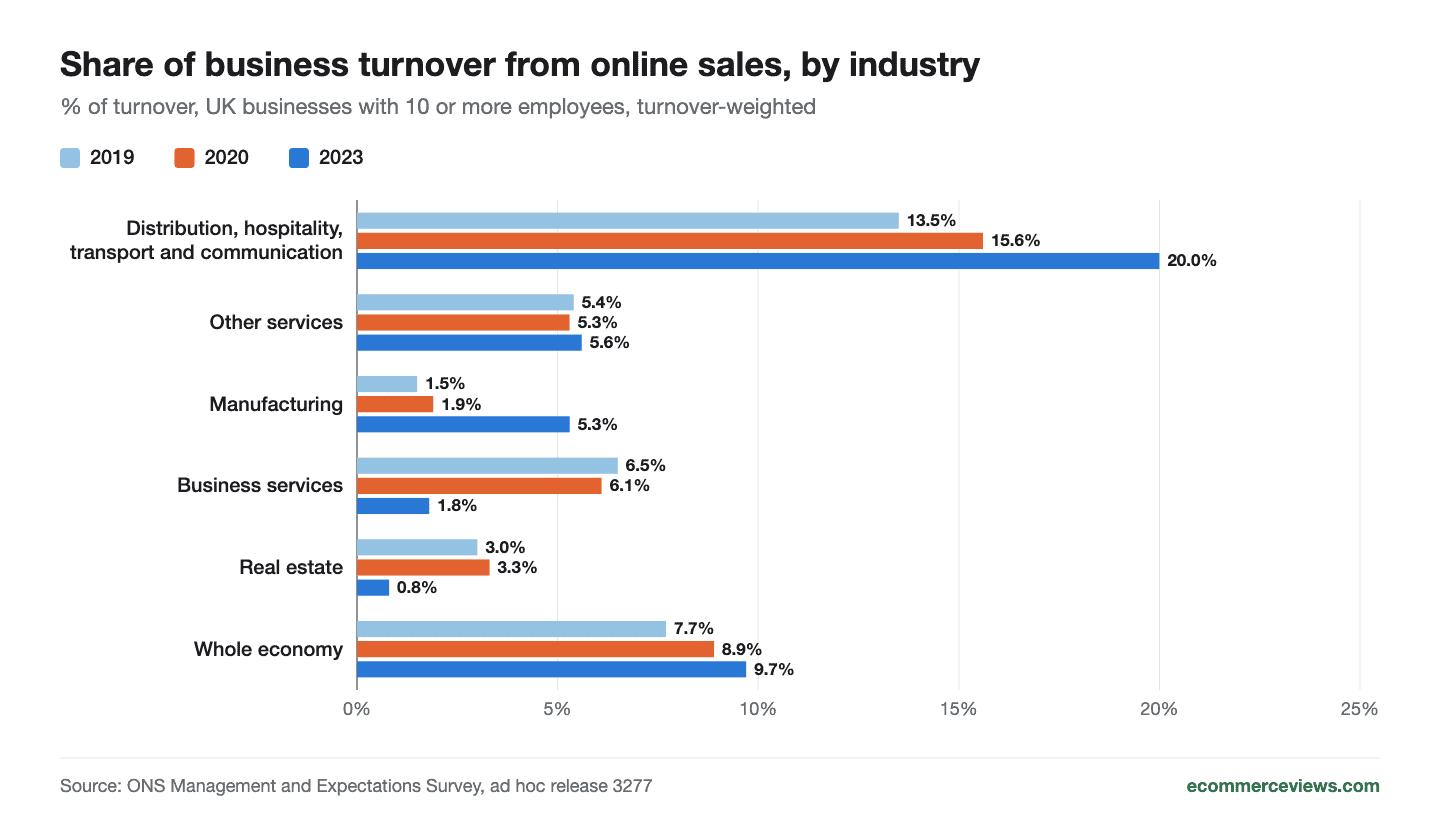
Share of business turnover from online sales by industry, 2019, 2020 and 2023
Across the whole economy, online sales made up 7.7% of turnover in 2019, 8.9% in 2020 and 9.7% in 2023. Unlike many pandemic-era trends, this one did not reverse: the 2023 figure is higher than the 2020 lockdown year.
| Industry group | 2019 | 2020 | 2023 |
|---|---|---|---|
| Distribution, hospitality, transport and communication | 13.5% | 15.6% | 20.0% |
| Other services | 5.4% | 5.3% | 5.6% |
| Manufacturing | 1.5% | 1.9% | 5.3% |
| Business services | 6.5% | 6.1% | 1.8% |
| Real estate | 3.0% | 3.3% | 0.8% |
| Whole economy | 7.7% | 8.9% | 9.7% |
Turnover-weighted share of turnover from online sales, UK businesses with 10 or more employees. Source: ONS Management and Expectations Survey, ad hoc release 3277.
The group that includes retail, wholesale, hospitality and transport now makes one pound in five online. Manufacturing more than tripled its online share, from 1.5% to 5.3%, as more manufacturers sell direct or through B2B portals. Business services moved the other way, which may reflect the voluntary survey’s small samples as much as a real shift.
Retail leads, construction barely sells online
By industry, retail has the highest share of businesses making website sales, at 34.5% in 2021, up from 26.5% in 2014. Accommodation and food services followed at 28.8%, driven by online bookings and food delivery. At the other end, only 0.1% of construction firms and 0.4% of transport and storage firms reported website sales.
| Industry | Share of businesses making website sales, 2021 | Share selling to customers outside the UK |
|---|---|---|
| Retail | 34.5% | 10.5% |
| Accommodation and food services | 28.8% | 0.5% |
| Wholesale | 18.3% | 5.4% |
| Manufacturing | 15.9% | 3.5% |
| Information and communication | 8.3% | 4.4% |
| Other services | 5.9% | 2.0% |
| Construction | 0.1% | 0.0% |
UK, 2021. Source: ONS, Digital Economy Survey 2021 (Table 5).
Even in retail, two thirds of businesses made no website sales in 2021. Many of them are small shops that sell only in person. Retail is also the sector with the highest share of online exporters, at 10.5%, almost double wholesale’s 5.4%. For retailers the online share of sales is a different measure again, which we covered in our analysis of 20 years of ONS online retail data.
Exporting online is still a big-firm activity
In 2021, UK businesses sold £77.8 billion through websites to customers outside the UK, 16.9% of all website sales. Only 2.9% of businesses made any such sales.
The difficulties reported for selling to EU customers point the same way as the EU data. High costs of delivering or returning products were the most commonly reported problem, ahead of product labelling and complaints handling. We found the same pattern across Europe in our study of why delivery costs, not VAT, are the biggest barrier to cross-border selling.
In 2019, the last year with the older geographic breakdown, 78.3% of UK website sales went to UK customers, 8.1% to EU customers and 13.6% to the rest of the world.
What this means for online stores
For a small UK business, these figures carry three practical messages.
- Selling online is still a competitive advantage. With roughly nine in ten UK businesses not taking orders online, a well-run web shop remains a point of difference in most sectors outside retail. In construction services, trade supplies, manufacturing and wholesale, online ordering is still rare.
- The money is in your own channel. Own websites and apps carried 93.5% of UK business website sales in 2021. Marketplaces are useful for reach, but they are a small share of the value, and their fees were the most common complaint from businesses that use them.
- Big firms are pulling away. The largest companies make most online sales and most online exports. Smaller firms compete best on niche range, service and speed rather than on price and scale.
Where small businesses can catch up
The data also shows where the gaps are.
- B2B ordering. Manufacturers tripled their online share of turnover between 2019 and 2023. Wholesalers and manufacturers that still take orders by phone and email have room to move trade buyers online.
- Selling abroad. Only 2.9% of UK businesses make website sales to non-UK customers. For small sellers with niche products, export demand is real, but delivery costs need pricing in from the start.
- Know your margins by channel. If more of your turnover goes online, fees, postage and payment costs make up more of your costs. Our free tools for UK online sellers cover profit, payment fees and postage.
Limits of the data
- Breaks between surveys. The E-commerce Survey ended with 2019 data. The Digital Economy Survey 2021 used a different method for sales values, and the ONS says comparisons with earlier years should be treated with caution.
- Wider definition from 2021. Website sales in 2021 include sales through own social media and online marketplaces, which earlier years may have counted differently.
- No EDI estimate for 2021. The ONS did not publish EDI sales for 2021 because of quality concerns, so total ecommerce sales after 2019 are not available.
- Small-business figures are less reliable. The ONS says results for firms with fewer than 10 employees were affected by low survey response in 2019, and the 2018 switch to online forms caused a break for this group.
- The turnover-share figures come from a voluntary survey of businesses with 10 or more employees, published as official statistics in development. Small samples may explain some sharp moves, such as the fall in business services.
- Current prices. None of the sales values are adjusted for inflation.
- Older detail. Some breakdowns, such as sales to private customers versus businesses and by country of customer, are only available up to 2019 in the E-commerce and ICT activity bulletin.
The bottom line
UK business ecommerce has grown into a £459 billion channel, and online sales now make up nearly a tenth of business turnover. But it has not become universal. Roughly one business in nine sells online, the same share as a decade ago, and the largest firms take most of the value and most of the exports. For small businesses, that is both a warning and an opening: online selling is still far from crowded in most sectors, and the firms that do it well keep a growing share of their market.